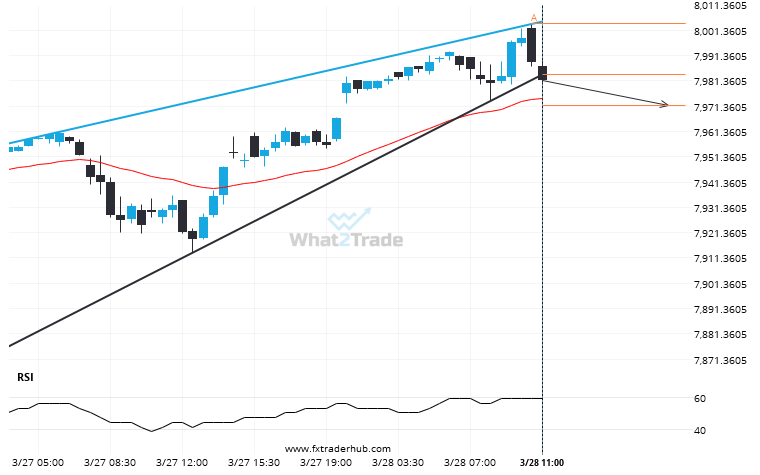
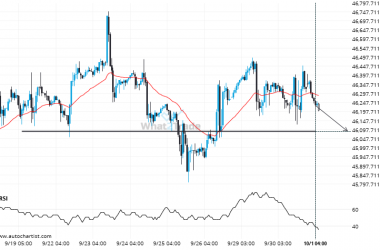
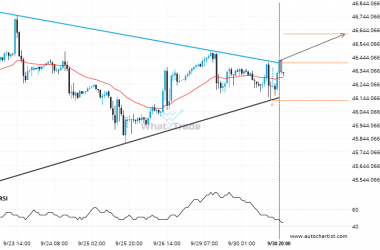
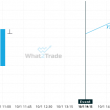
UK100 moved through the support line of a Rising Wedge at 7983.8448275862065 on the 30 Minutes chart. This line has been tested a number of times in the past and this breakout could mean an upcoming change from the current trend. It may continue in its current direction toward 7971.8199.
ARTÍCULOS RELACIONADOS
DOW 30 through 44433.30789473684. Is this a confirming a breakout? Will it continue its path in the current trend toward 44187.7178?
DOW 30 moved through the support line of a Triangle at 44433.30789473684 on the 4 hour chart. This…
CAC 40 is quickly approaching a very important level it has previously tested numerous times in the past
CAC 40 is about to retest a key horizontal support level near 7756.0000. It has tested this level…
ASX 200 – approaching a support line that has been previously tested at least twice in the past
Emerging Triangle detected on ASX 200 – the pattern is an emerging one and has not yet broken…