Receive the latest alerts via email

TSLA is signaling a possible trend reversal on the intraday charts with price not breaching resistance.

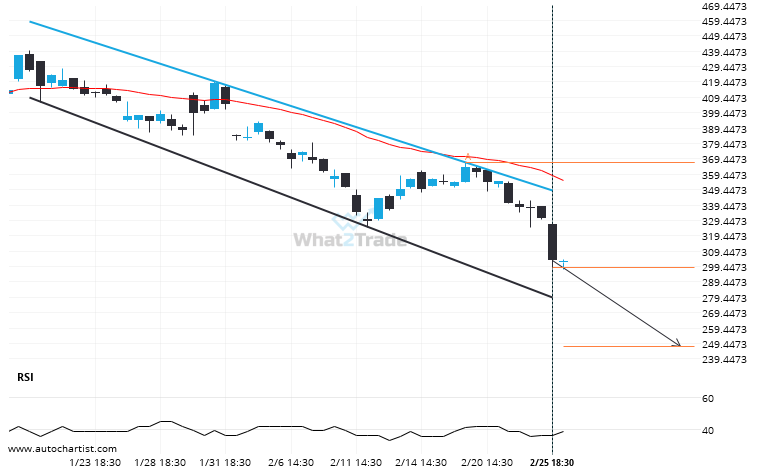
A Channel Down pattern was identified on TSLA at 298.79, creating an expectation that it may move to the support line at 247.3329. It may break through that line and continue the bearish trend or it may reverse from that line.

Total
0
Shares
Previous Post

Bulls aim for 67.9422 after the US Oil triggered a bearish formation on the 4 hour chart

Next Post

Supports and resistances are primary concepts of technical analysis. DASHEUR is heading for an important price of 26.7000 – read about what this could mean for the future.

ARTÍCULOS RELACIONADOS