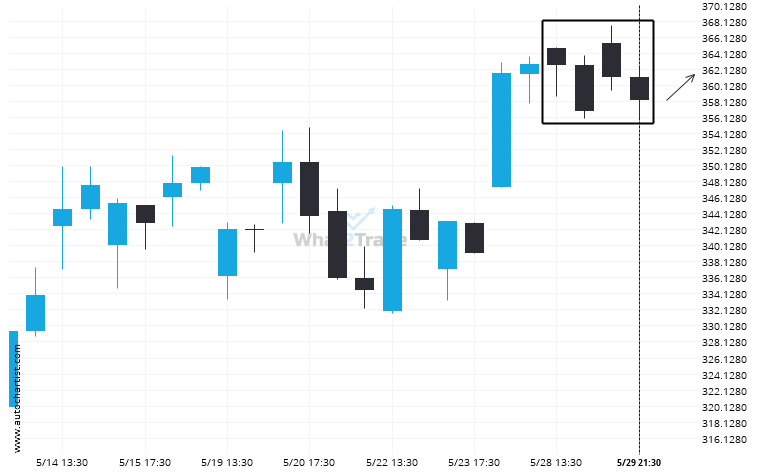
Due to the rate of consecutive bearish candles on TSLA 4 hour chart we could be in for a price correction. If not, this trend could be a sign of things to come
ARTÍCULOS RELACIONADOS
If AAPL touches 211.8250 it may be time to take action.
The movement of AAPL towards 211.8250 price line is yet another test of the line it reached numerous…
XOM is signaling a possible trend reversal on the intraday charts with price not breaching support.
XOM was identified at around 115.01 having recently rebounded of the support on the 15 Minutes data interval.…
BRK.B may be on a start of a new bearish trend after its breakout through this important support level
BRK.B has broken through a line of 481.9500. If this breakout holds true, we could see the price…