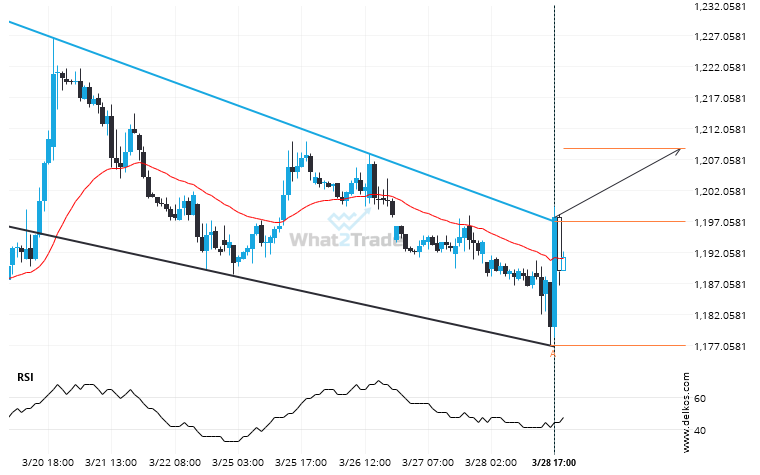
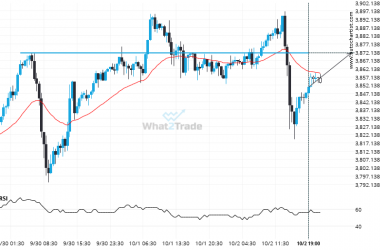
Soybeans May 2024 has broken through the resistance line of a Falling Wedge technical chart pattern. Because we have seen it retrace from this line in the past, one should wait for confirmation of the breakout before taking any action. It has touched this line twice in the last 10 days and suggests a possible target level to be around 1208.9141 within the next 3 days.
There is a possibility of a big movement on Soybeans May 2024 after a breach of the resistance