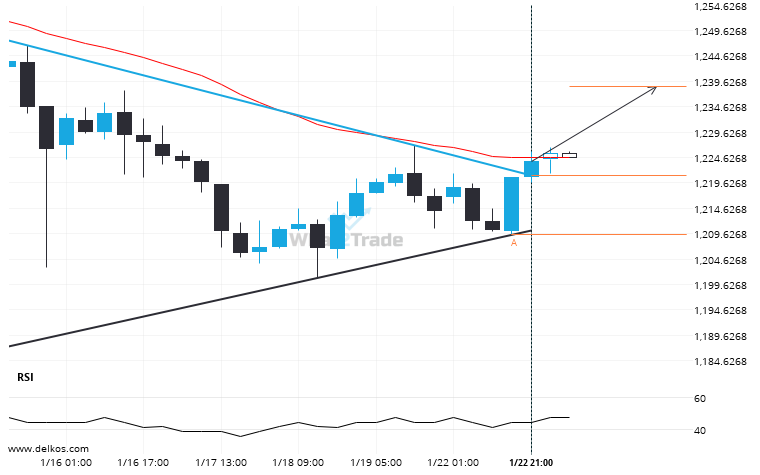
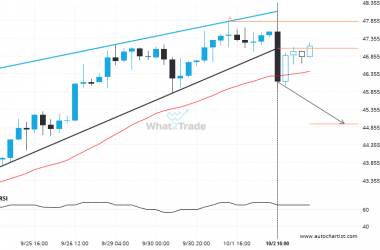
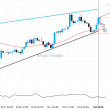
Soybeans March 2024 has broken through a resistance line of a Triangle chart pattern. If this breakout holds true, we may see the price of Soybeans March 2024 testing 1238.6548 within the next 22 hours. But don’t be so quick to trade, it has tested this line in the past, so you should confirm the breakout before taking any action.
ARTÍCULOS RELACIONADOS
A possible move on US Oil as it heads towards support
The movement of US Oil towards the support line of a Falling Wedge is yet another test of…
Silver Spot – approaching a price line that has been previously tested numerous times in the past
The movement of Silver Spot towards 33.4349 price line is yet another test of the line it reached…
Important resistance line being approached by Brent Crude. This price has been tested numerous time in the last 5 days
Brent Crude is trapped in a Rising Wedge formation, implying that a breakout is Imminent. This is a…