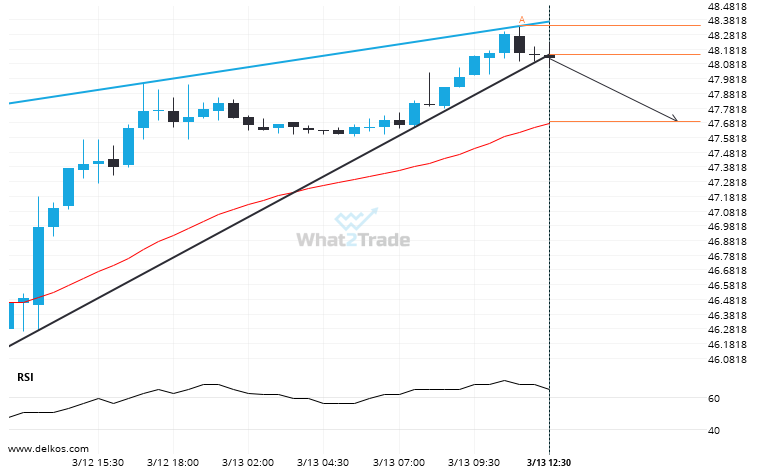
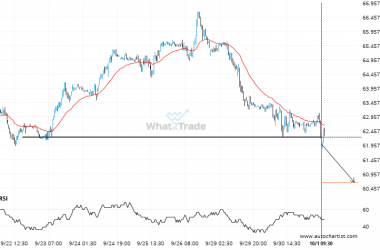
Soybean Oil May 2024 moved through the support line of a Rising Wedge at 48.1468 on the 30 Minutes chart. This line has been tested a number of times in the past and this breakout could mean an upcoming change from the current trend. It may continue in its current direction toward 47.6883.
ARTÍCULOS RELACIONADOS
Important support line being approached by US Oil. This price has been tested numerous time in the last 8 days
An emerging Falling Wedge has been detected on US Oil on the 30 Minutes chart. There is a…
Because Gold Spot formed a Channel Up pattern, we expect it to touch the support line. If it breaks through support it may move much lower
Gold Spot is moving towards a support line. Because we have seen it retrace from this line before,…
US Oil is currently testing a level of 62.2340. Will the breakout continue or will things reverse?
US Oil has broken through 62.2340 which it has tested numerous times in the past. We have seen…