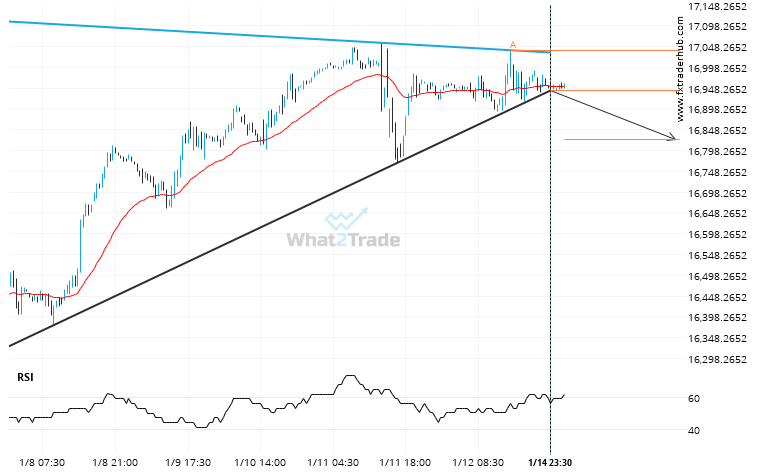
The last 18 30 Minutes candles on NAS100 formed a Triangle pattern and broken out through the pattern lines, indicating a possible bearish movement towards the price level of 16825.7659.
ARTÍCULOS RELACIONADOS
Nikkei 225 keeps moving closer towards 39216.0000. Will it finally breach this level?
Nikkei 225 is heading towards 39216.0000 and could reach this point within the next 3 days. It has…
DOW 30 through 44390.40419354839. Is this a confirming a breakout? Will it continue its path in the current trend toward 43870.8429?
The last 11 4 hour candles on DOW 30 formed a Triangle pattern and broken out through the…
Will CAC 40 break through the support level it tested before?
CAC 40 is heading towards a line of 8088.0000. If this movement continues, the price of CAC 40…