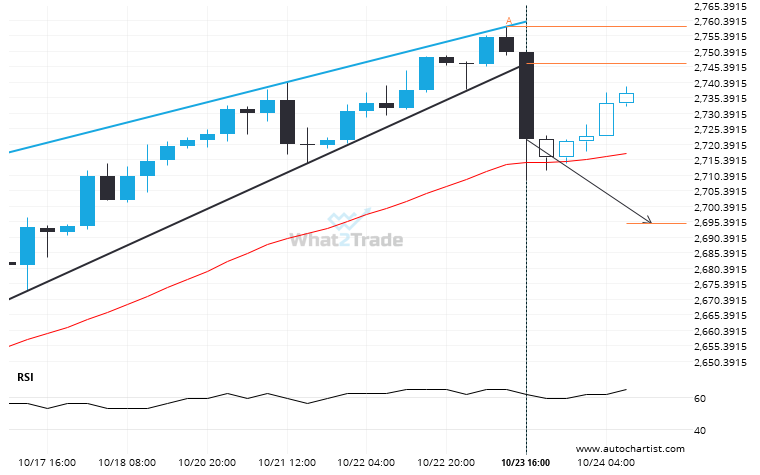
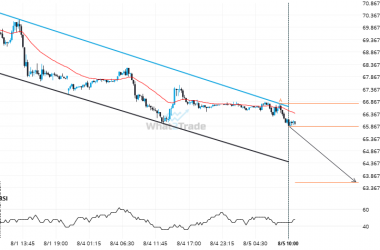
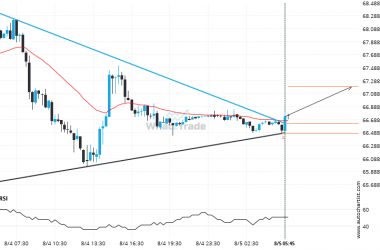
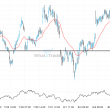
Gold Spot has broken through the support line of a Rising Wedge technical chart pattern. Because we have seen it retrace from this line in the past, one should wait for confirmation of the breakout before taking any action. It has touched this line twice in the last 13 days and suggests a possible target level to be around 2694.7553 within the next 10 hours.
ARTÍCULOS RELACIONADOS
Natural Gas is quickly approaching a very important level it has previously tested numerous times in the past
Natural Gas is heading towards 3.0805 and could reach this point within the next 2 days. It has…
US Oil is approaching a support line of a Channel Down. It has touched this line numerous times in the last 5 days.
The movement of US Oil towards the support line of a Channel Down is yet another test of…
Breach of resistance could mean a start of a bullish trend on US Oil
US Oil has broken through a resistance line of a Triangle and suggests a possible movement to 67.1989…