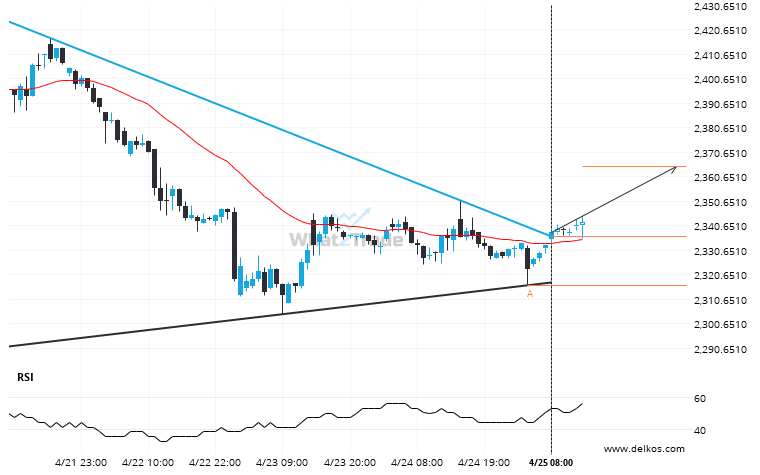
Triangle pattern identified on Gold June 2024 has broken through a resistance level with the price momentum continuing to move in an upward direction. A solid trading opportunity continues with the price expected to reach 2364.6900 in the next 22.
ARTÍCULOS RELACIONADOS
Gold Spot is signaling a possible trend reversal on the intraday charts with price not breaching support.
Gold Spot was identified at around 3397.525 having recently rebounded of the support on the 4 hour data…
Natural Gas likely to test 3.1605 in the near future. Where to next?
The price of Natural Gas in heading back to the resistance area. It is possible that it will…
Because Gold Spot formed a Inverse Head and Shoulders pattern, we expect it to touch the resistance line. If it breaks through resistance it may move much higher
Gold Spot is heading towards the resistance line of a Inverse Head and Shoulders and could reach this…