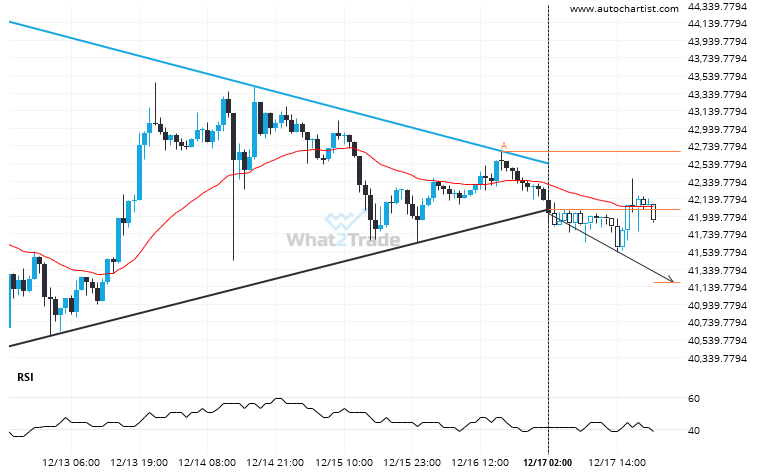
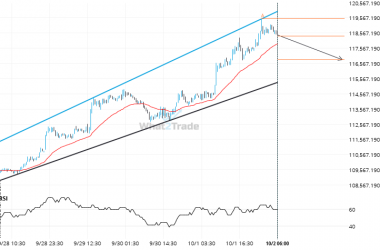
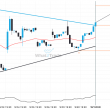
BTCUSD moved through the support line of a Triangle at 42019.77214285714 on the 1 hour chart. This line has been tested a number of times in the past and this breakout could mean an upcoming change from the current trend. It may continue in its current direction toward 41186.9226.
ARTÍCULOS RELACIONADOS
BTCJPY – approaching a resistance line that has been previously tested at least twice in the past
BTCJPY is trapped in a Channel Down formation, implying that a breakout is Imminent. This is a great…
A final push possible on BCHUSD as it starts approaching a price line of 346.2700.
BCHUSD is en route to a very important line that will be a definite deciding factor of what…
Important support line being approached by LTCAUD. This price has been tested numerous time in the last 6 days
LTCAUD is moving towards a support line. Because we have seen it retrace from this line before, we…