
Browsing Tag
YM
920 posts
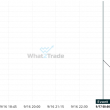
US30 moves higher to 33,222 in the last 11 days.
A movement of 6.34% over 11 days on US30 doesn’t go unnoticed. You may start considering where it’s…
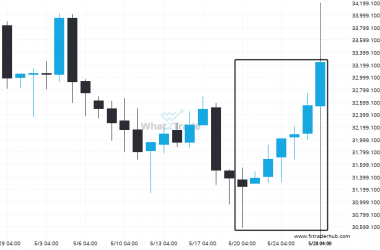
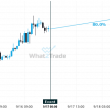
US30 moves higher to 33,237 in the last 9 days.
A movement of 6.39% over 9 days on US30 doesn’t go unnoticed. You may start considering where it’s…
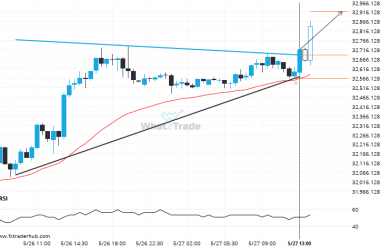
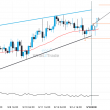
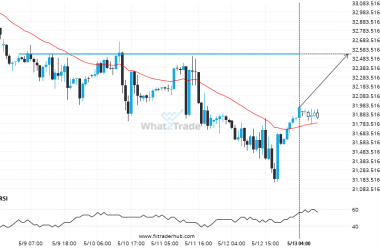
US30 – breach of a trending resistance line that has been tested at least twice before.
US30 has broken through the resistance line of a Triangle technical chart pattern. Because we have seen it…
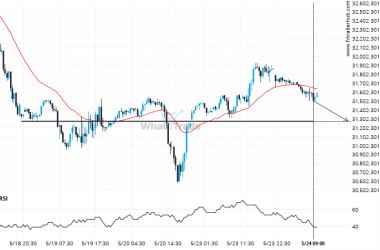
After testing 31274.0000 numerous times, US30 is once again approaching this price point. Can we expect a bearish trend to follow?
The movement of US30 towards 31274.0000 price line is yet another test of the line it reached numerous…
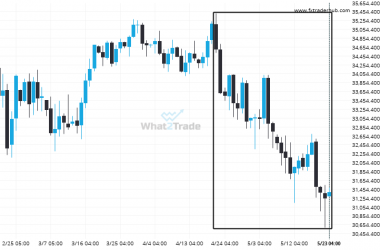
US30 experienced a very large 33 days bearish move to 31,377
US30 has moved lower by 9.3% from 35,168 to 31,377 in the last 33 days.
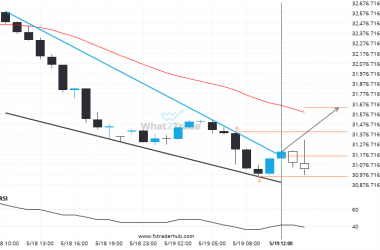
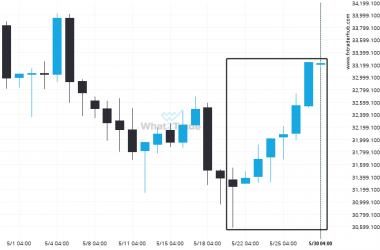
Breach of resistance could mean a start of a bullish trend on US30
US30 has broken through a resistance line of a Falling Wedge chart pattern. If this breakout holds true,…
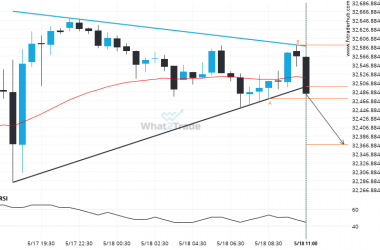
After testing support twice in the past, US30 has finally broken through. Can we expect a bearish trend to follow?
The breakout of US30 through the support line of a Triangle could be a sign of the road…
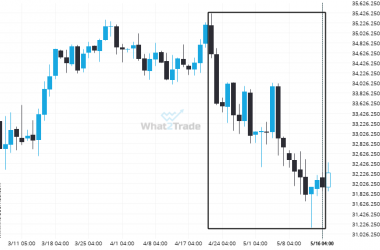
After experiencing a 7.65% bearish move in the space of 26 days, nobody knows where US30 is headed.
Those of you that are trend followers are probably eagerly watching US30 to see if its latest 7.65%…
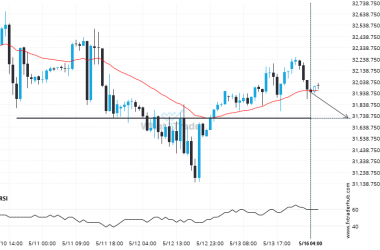
US30 – approaching a price line that has been previously tested numerous times in the past
US30 is moving towards a support line. Because we have seen it retrace from this level in the…
After testing 32534.0000 numerous times, US30 is once again approaching this price point. Can we expect a bullish trend to follow?
The movement of US30 towards 32534.0000 price line is yet another test of the line it reached numerous…