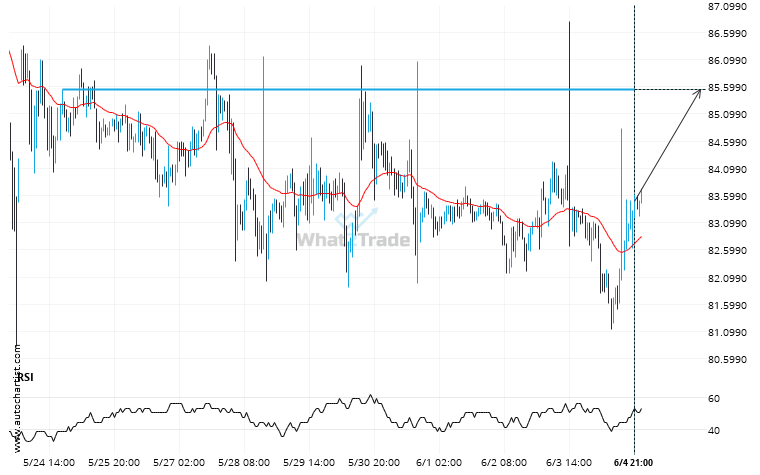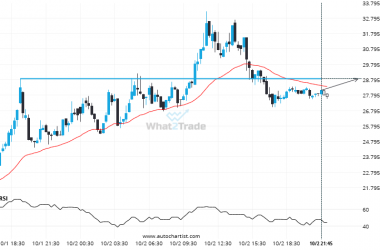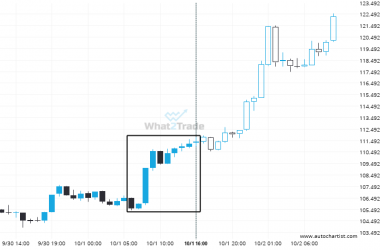
LTCUSD is approaching a resistance line at 85.5500. If it hits the resistance line, it may break through this level to continue the bullish trend, or it may turn around back to current levels.
Supports and resistances are primary concepts of technical analysis. LTCUSD is heading for an important price of 85.5500 – read about what this could mean for the future.