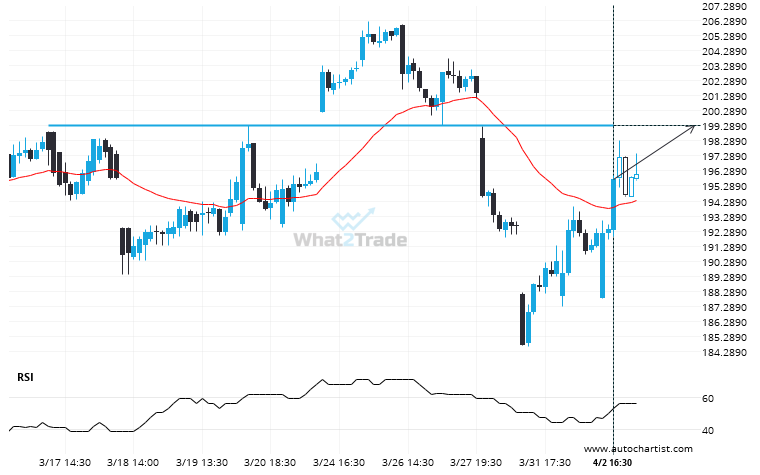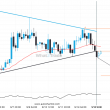
AMZN is moving towards a resistance line. Because we have seen it retrace from this level in the past, we could see either a break through this line, or a rebound back to current levels. It has touched this line numerous times in the last 17 days and may test it again within the next 20 hours.
Supports and resistances are primary concepts of technical analysis. AMZN is heading for an important price of 199.2800 – read about what this could mean for the future.