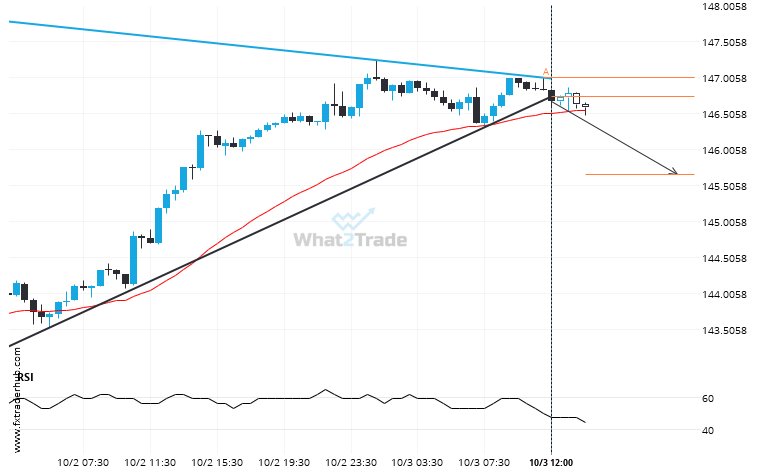
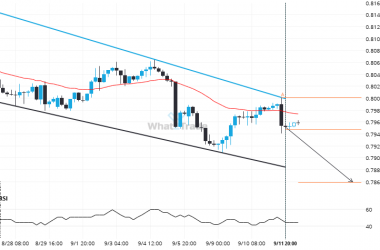
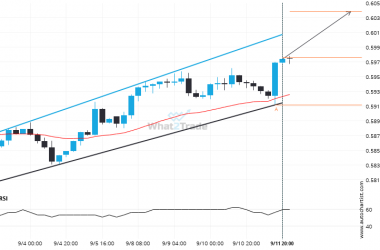
USD/JPY moved through the support line of a Triangle at 146.72946153846152 on the 30 Minutes chart. This line has been tested a number of times in the past and this breakout could mean an upcoming change from the current trend. It may continue in its current direction toward 145.6497.
ARTÍCULOS RELACIONADOS
AUDNZD has broken through a resistance line. It has touched this line numerous times in the last 8 days.
AUDNZD has broken through a resistance line. It has touched this line numerous times in the last 8…
A possible move on USDCHF as it heads towards support
USDCHF is moving towards a support line which it has tested numerous times in the past. We have…
A Channel Up has formed, NZDUSD is approaching support. Can we expect a breakout and the start of a new trend or a reversal?
Emerging Channel Up pattern in its final wave was identified on the NZDUSD 4 hour chart. After a…


