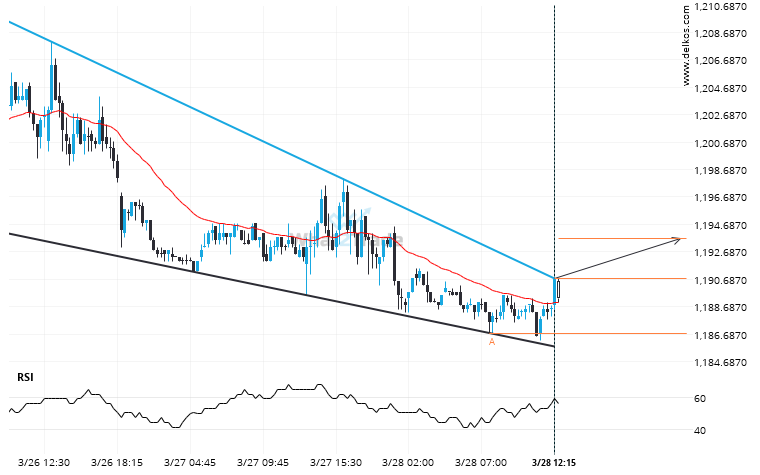
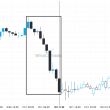
Soybeans May 2024 moved through the resistance line of a Falling Wedge at 1190.75 on the 15 Minutes chart. This line has been tested a number of times in the past and this breakout could mean an upcoming change from the current trend. It may continue in its current direction toward 1193.6635.
ARTÍCULOS RELACIONADOS
After experiencing a 15.2% bullish move in the space of 16 days, nobody knows where Gold Spot is headed.
An unexpected large move has occurred on Gold Spot Daily chart beginning at 2981.4645 and ending at 3434.52.…
It’s time to make a decision on Natural Gas – its recent breach of 3.0285 could be a sign of a new trend to follow.
Natural Gas has breached the resistance line at 3.0285. It may continue the bullish trend towards 3.0734, or,…
Brent Crude is signaling a possible trend reversal on the intraday charts with price not breaching support.
Brent Crude is heading towards the resistance line of a Channel Up and could reach this point within…