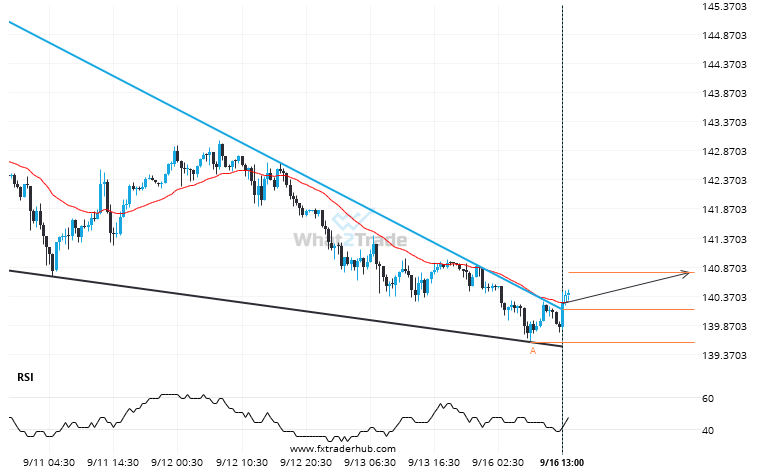
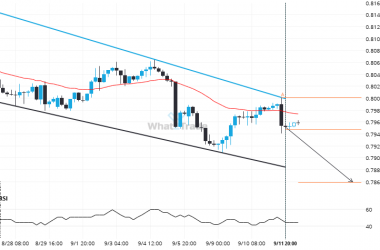
USD/JPY moved through the resistance line of a Falling Wedge at 140.13712698412698 on the 30 Minutes chart. This line has been tested a number of times in the past and this breakout could mean an upcoming change from the current trend. It may continue in its current direction toward 140.7848.
ARTÍCULOS RELACIONADOS
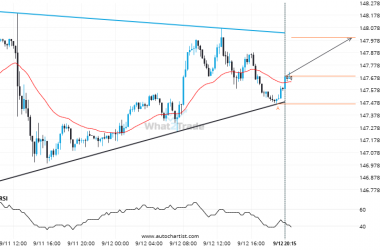
A Triangle has formed, USDJPY is approaching support. Can we expect a breakout and the start of a new trend or a reversal?
An emerging Triangle has been detected on USDJPY on the 15 Minutes chart. There is a possible move…
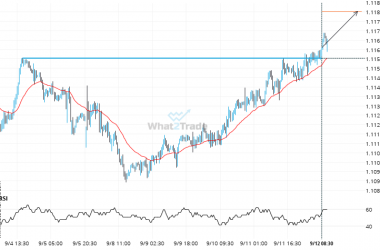
AUDNZD has broken through a resistance line. It has touched this line numerous times in the last 8 days.
AUDNZD has broken through a resistance line. It has touched this line numerous times in the last 8…
A possible move on USDCHF as it heads towards support
USDCHF is moving towards a support line which it has tested numerous times in the past. We have…

