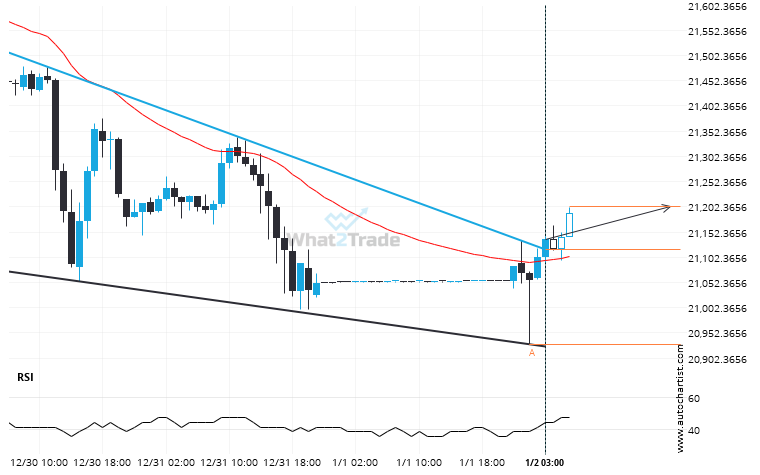
NAS 100 moved through the resistance line of a Falling Wedge at 21118.40289 on the 1 hour chart. This line has been tested a number of times in the past and this breakout could mean an upcoming change from the current trend. It may continue in its current direction toward 21203.0491.
ARTÍCULOS RELACIONADOS
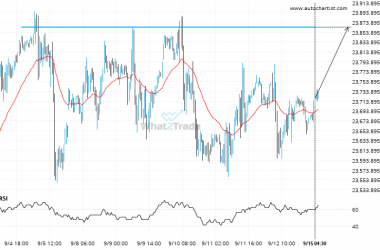
DAX 40 keeps moving closer towards 23863.9004. Will it finally breach this level?
DAX 40 is about to retest a key horizontal resistance level near 23863.9004. It has tested this level…
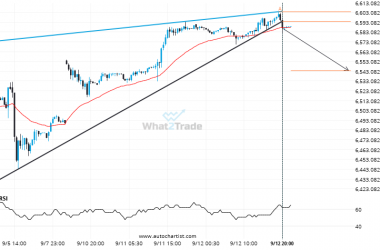
Breach of support could mean a start of a bearish trend on US 500
This trade setup on US 500 is formed by a period of consolidation; a period in which the…
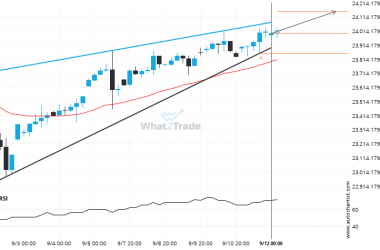
NAS 100 is signaling a possible trend reversal on the intraday charts with price not breaching support.
NAS 100 is heading towards the resistance line of a Rising Wedge. If this movement continues, the price…

