
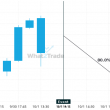
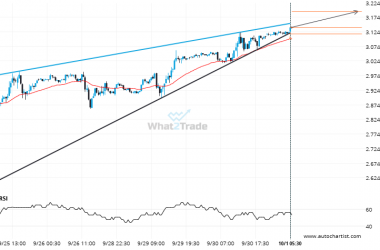
E-mini S&P 500 MARCH 2020 has broken through the resistance line which it has tested twice in the past. We have seen it retrace from this position before, so one should wait for confirmation of the breakout before trading. If this new trend persists, a target line of around 3306.4067 can be expected within the next 15 hours.

ARTÍCULOS RELACIONADOS
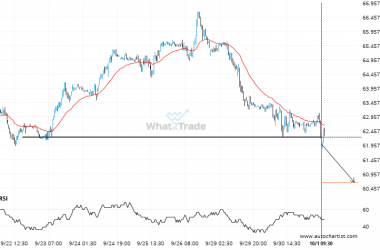
US Oil is currently testing a level of 62.2340. Will the breakout continue or will things reverse?
US Oil has broken through 62.2340 which it has tested numerous times in the past. We have seen…
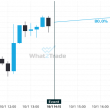
A Rising Wedge has formed, Natural Gas is approaching support. Can we expect a breakout and the start of a new trend or a reversal?
Natural Gas was identified at around 3.1395 having recently rebounded of the support on the 30 Minutes data…
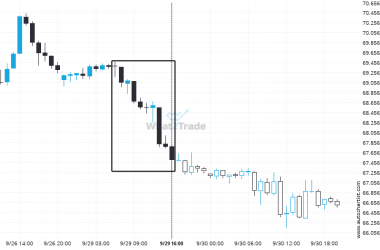
An unexpected large move occurred on Brent Crude 1 hour chart. The shift stands out in recent activity.
Brent Crude just posted a 2.7% move over the past 10 hours – a move that won’t go…