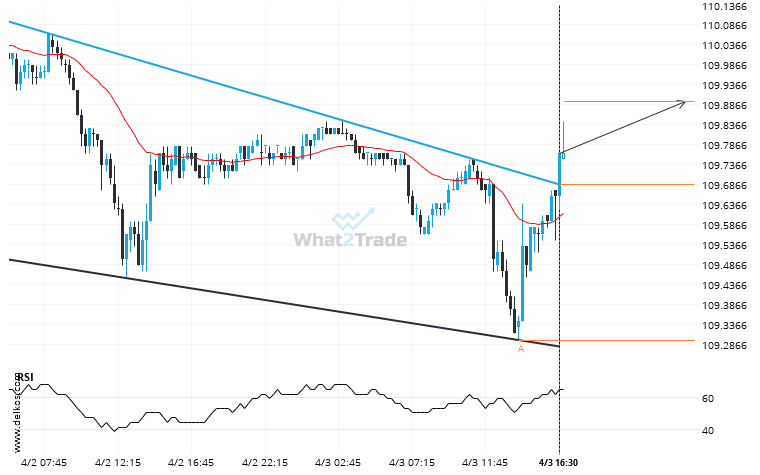
10 Yr Us Treasury Note June 2024 moved through the resistance line of a Falling Wedge at 109.686286407767 on the 15 Minutes chart. This line has been tested a number of times in the past and this breakout could mean an upcoming change from the current trend. It may continue in its current direction toward 109.8950.
ARTÍCULOS RELACIONADOS
Brent Crude breakout from a Pennant trade setup. Will it continue this trend to hit the target price?
Brent Crude moved through the support line of a Pennant at 77.09933333333333 on the 4 hour chart. This…
Brent Crude – approaching a price line that has been previously tested numerous times in the past
Brent Crude is moving towards a key support level at 74.3240. This is a previously tested level for…
US Oil – approaching a price line that has been previously tested numerous times in the past
US Oil is moving towards a line of 72.7510 which it has tested numerous times in the past.…