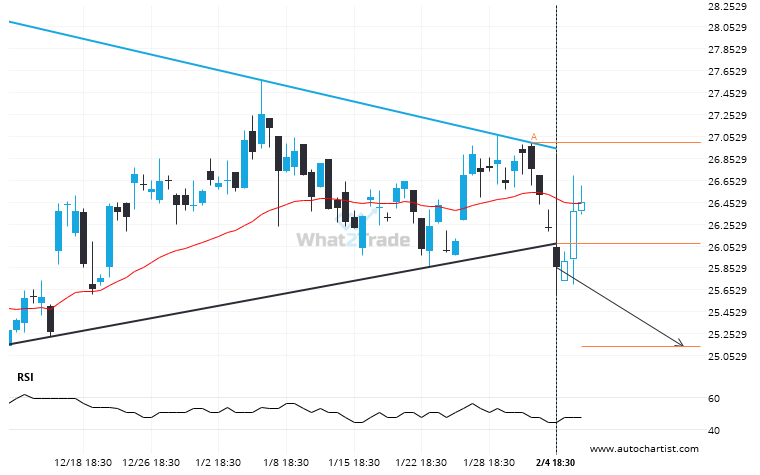
PFE has broken through the support line of a Triangle technical chart pattern. Because we have seen it retrace from this line in the past, one should wait for confirmation of the breakout before taking any action. It has touched this line twice in the last 58 days and suggests a possible target level to be around 25.1341 within the next 3 days.
ARTÍCULOS RELACIONADOS
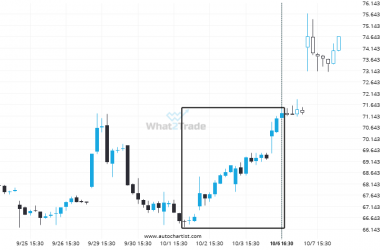
Big bullish swing on PYPL – this may be one of its more notable movements in the recent session.
PYPL reached 71.24 after a 7.18% move spanning 5 days.
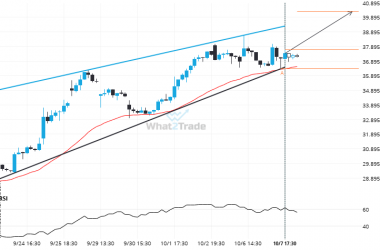
INTC formed a Rising Wedge on the 1 hour chart. Retest of resistance in sight.
Emerging Rising Wedge pattern in its final wave was identified on the INTC 1 hour chart. After a…
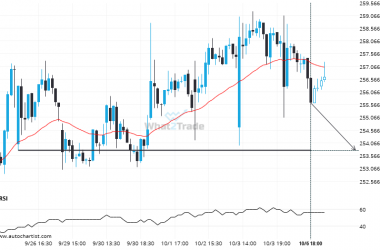
AAPL likely to test 253.7800 in the near future. Where to next?
AAPL is approaching a support line at 253.7800. If it hits the support line, it may break through…


