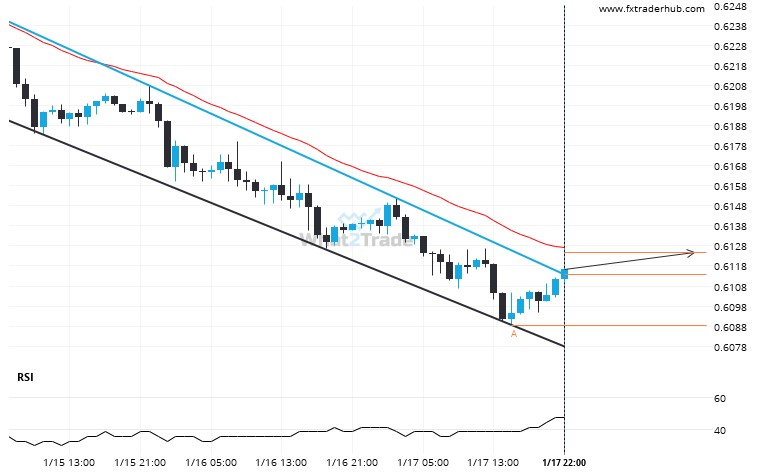
NZD/USD has broken through the resistance line of a Channel Down technical chart pattern. Because we have seen it retrace from this line in the past, one should wait for confirmation of the breakout before taking any action. It has touched this line twice in the last 6 days and suggests a possible target level to be around 0.6125 within the next 19 hours.
ARTÍCULOS RELACIONADOS
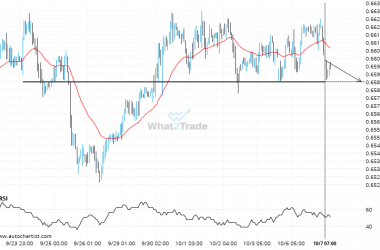
AUDUSD likely to test 0.6584 in the near future. Where to next?
AUDUSD is en route to a very important line that will be a definite deciding factor of what…
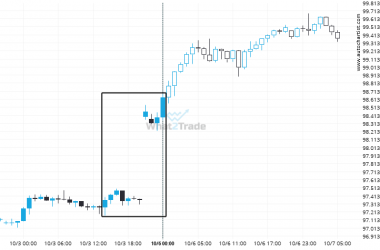
AUDJPY experienced a 1.31% bullish move in just 3 days. The magnitude speaks for itself.
AUDJPY reached 98.6335 after a 1.31% move spanning 3 days.
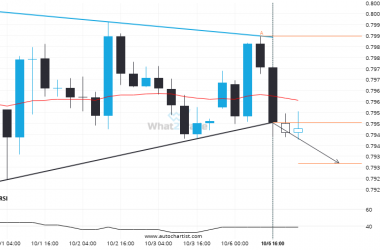
There is a possibility of a big movement on USDCHF after a breach of the support
USDCHF has broken through a support line. It has touched this line at least twice in the last…

