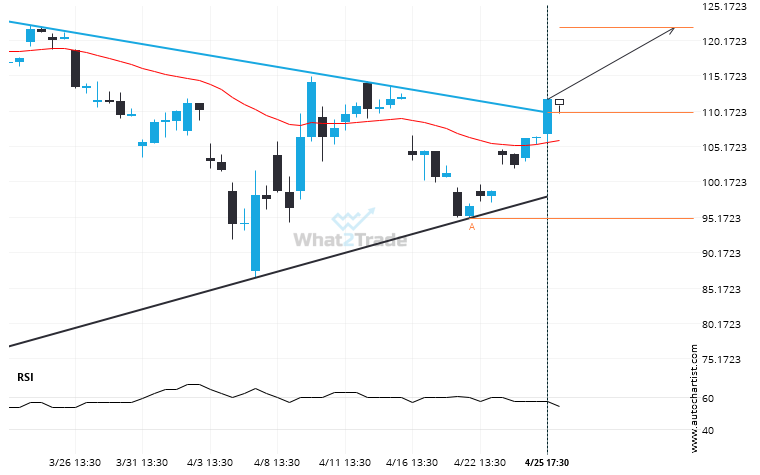
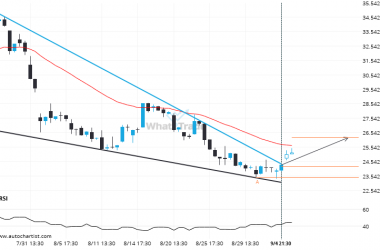
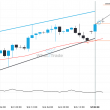
NVDA moved through the resistance line of a Triangle at 110.01310344827588 on the 4 hour chart. This line has been tested a number of times in the past and this breakout could mean an upcoming change from the current trend. It may continue in its current direction toward 122.0188.
ARTÍCULOS RELACIONADOS
It’s time to make a decision on AMD – its recent breach of 156.4400 could be a sign of a new trend to follow.
The price of AMD in heading in the direction of 142.6520. Despite the recent breakout through 156.4400 it…
After testing resistance twice in the past, MRNA has finally broken through. Can we expect a bullish trend to follow?
The breakout of MRNA through the resistance line of a Falling Wedge could be a sign of the…
PFE heading towards a price it has tested 4 times in the recent past.
PFE is moving towards a key resistance level at 25.2000. PFE has previously tested this level 4 times…