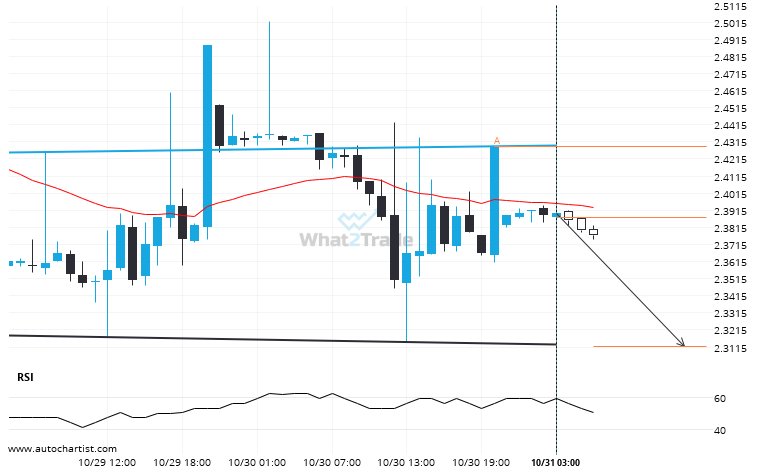
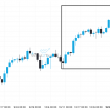
Emerging Head and Shoulders pattern in its final wave was identified on the Natural Gas 1 hour chart. After a strong bearish run, we find Natural Gas heading towards the upper triangle line with a possible resistance at 2.3117. If the support shows to hold, the Head and Shoulders pattern suggests a rebound back towards current levels.
ARTÍCULOS RELACIONADOS
Important resistance line being approached by Silver Spot. This price has been tested numerous time in the last 6 days
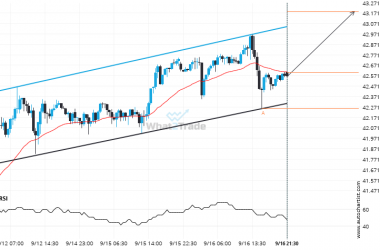
An emerging Channel Up has been detected on Silver Spot on the 30 Minutes chart. There is a…
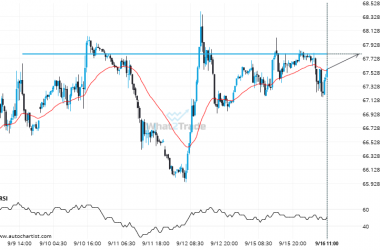
Brent Crude likely to test 67.7885 in the near future. Where to next?
Brent Crude is moving towards a key resistance level at 67.7885. This is a previously tested level for…
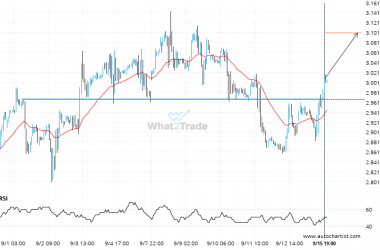
Important price line breached by Natural Gas. This price has been tested numerous times before.
Natural Gas has breached the resistance line at 2.9680. It may continue the bullish trend towards 3.1010, or,…

