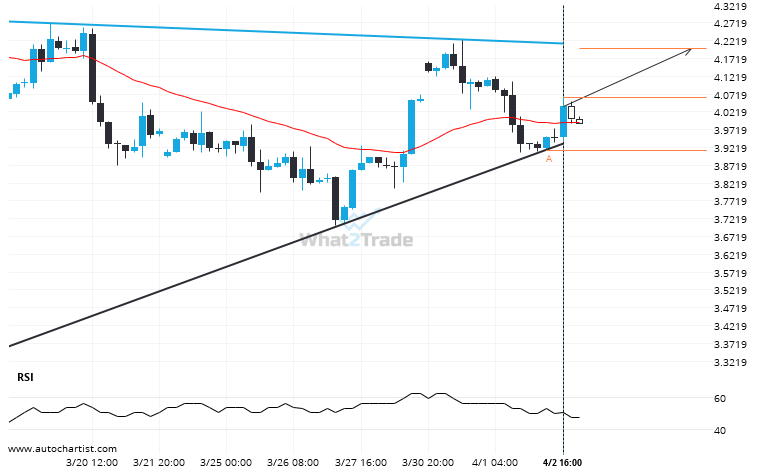
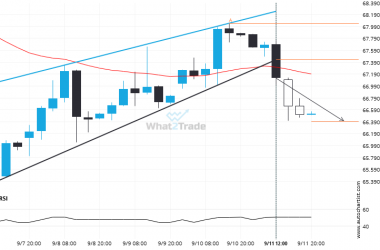
An emerging Triangle has been detected on Natural Gas on the 4 hour chart. There is a possible move towards 4.1999 next few candles. Once reaching support it may continue its bullish run or reverse back to current price levels.
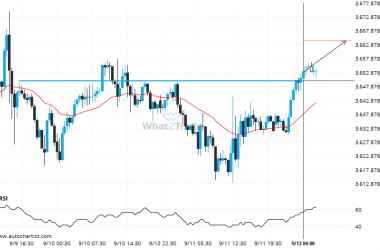
ARTÍCULOS RELACIONADOS
Gold Spot has broken out from the Triangle pattern. Expect it to hit 3291.9738 soon.
Triangle pattern identified on Gold Spot has broken through a support level with the price momentum continuing to…
There is a possibility of a big movement on Silver Spot after a breach of the support
Silver Spot has broken through the support line which it has tested twice in the past. We have…
US Oil heading towards a price it has tested 4 times in the recent past.
US Oil is about to retest a key horizontal resistance level near 63.6715. It has tested this level…