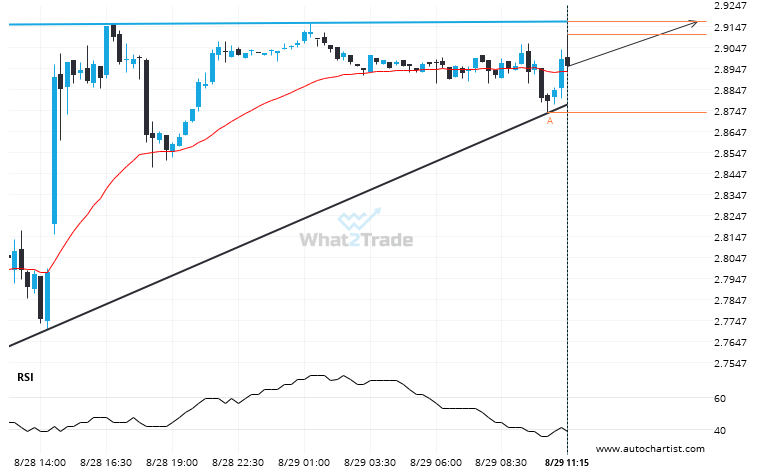
Emerging Ascending Triangle detected on Natural Gas – the pattern is an emerging one and has not yet broken through support, but the price is expected to move up over the next few hours. The price at the time the pattern was found was 2.9105 and it is expected to move to 2.9170.
ARTÍCULOS RELACIONADOS
Gold Spot experienced a very large 48 days bullish move to 3909.648.
Gold Spot reached 3909.648 after a 16.81% move spanning 48 days.
Brent Crude through 65.85670422535212. Is this a confirming a breakout? Will it continue its path in the current trend toward 67.7624?
Triangle pattern identified on Brent Crude has broken through a resistance level with the price momentum continuing to…
Will US Oil break through the resistance level it tested before?
US Oil is moving towards a key resistance level at 62.0110. This is a previously tested level for…