An unexpected large move has occurred on NAS100 Daily chart beginning at 14295.0 and ending at 16052.75. Is this a sign of something new? What can we expect in the future?
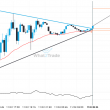
NAS100 – It’s perhaps in these huge moves where the greatest opportunity lies
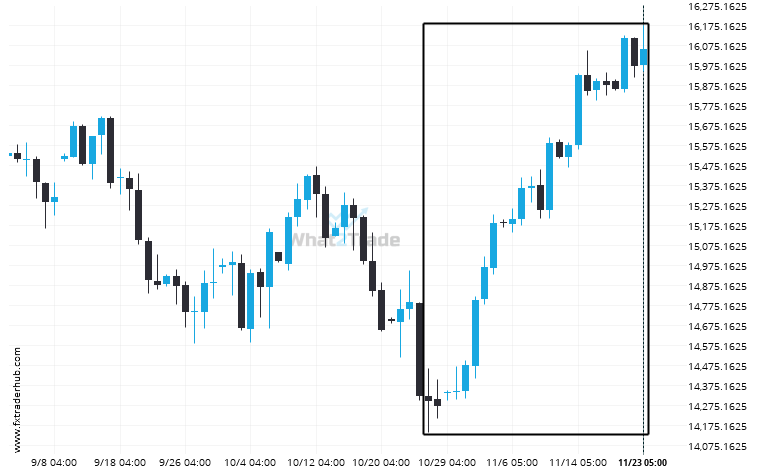

An unexpected large move has occurred on NAS100 Daily chart beginning at 14295.0 and ending at 16052.75. Is this a sign of something new? What can we expect in the future?