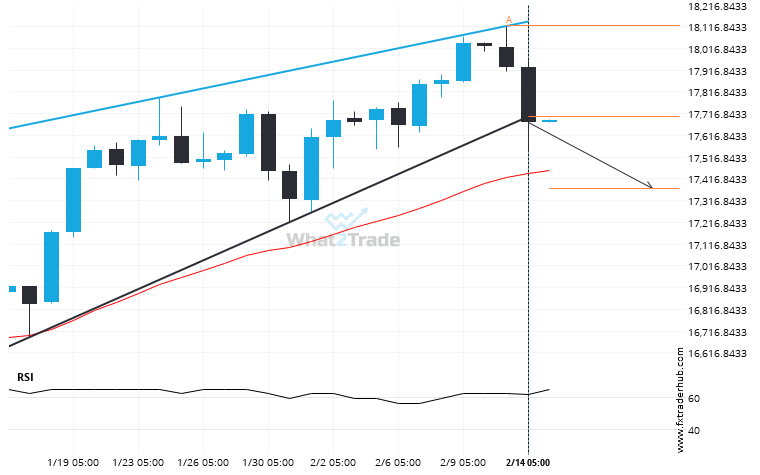
NAS100 moved through the support line of a Rising Wedge at 17703.903846153844 on the Daily chart. This line has been tested a number of times in the past and this breakout could mean an upcoming change from the current trend. It may continue in its current direction toward 17370.7197.
ARTÍCULOS RELACIONADOS
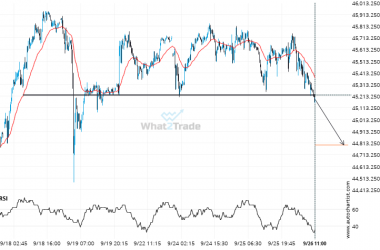
Nikkei 225 may be on a start of a new bearish trend after its breakout through this important support level
Nikkei 225 is once again retesting a key horizontal support level at 45225.0000. It has tested this level…
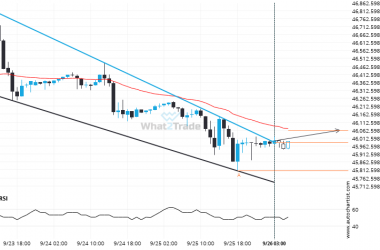
DOW 30 has broken through resistance of a Falling Wedge. It has touched this line at least twice in the last 3 days.
The breakout of DOW 30 through the resistance line of a Falling Wedge could be a sign of…
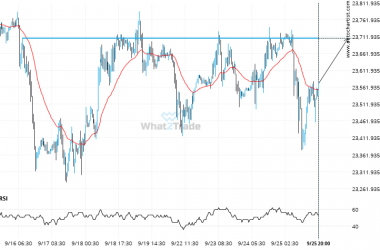
A final push possible on DAX 40 as it starts approaching a price line of 23706.9004.
DAX 40 is moving towards a line of 23706.9004 which it has tested numerous times in the past.…

