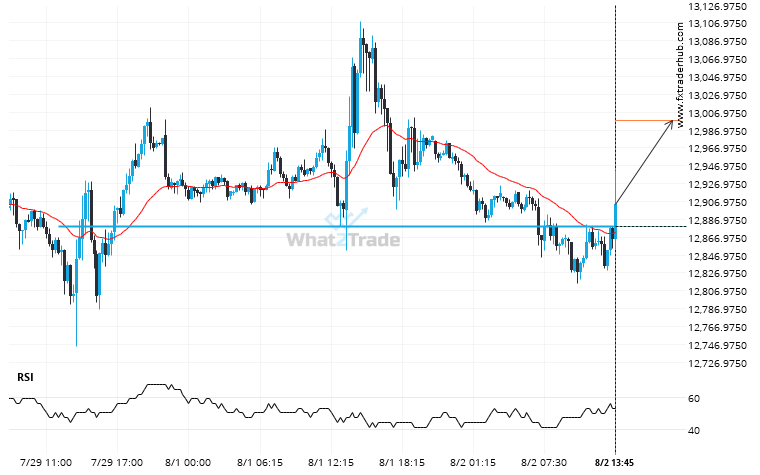
NAS100 has broken through a resistance line. It has touched this line numerous times in the last 5 days. This breakout shows a potential move to 12997.5996 within the next 12 hours. Because we have seen it retrace from this level in the past, one should wait for confirmation of the breakout.
ARTÍCULOS RELACIONADOS
Nikkei 225 – approaching a price line that has been previously tested numerous times in the past
Nikkei 225 is moving towards a line of 44575.0000 which it has tested numerous times in the past.…
ASX 200 formed a Channel Down on the 1 hour chart. Retest of support in sight.
A Channel Down pattern was identified on ASX 200 at 8742.0, creating an expectation that it may move…
Rare bullish streak on the NAS 100 4 hour chart.
Rare candle sequence recorded on the NAS 100 4 hour chart, ending at 24497.3588.