Receive the latest alerts via email

NAS 100 – breach of price line that’s been previously tested numerous times before

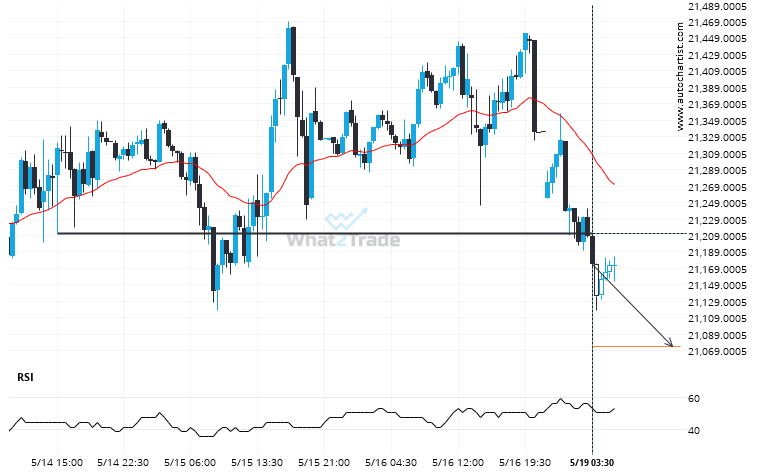
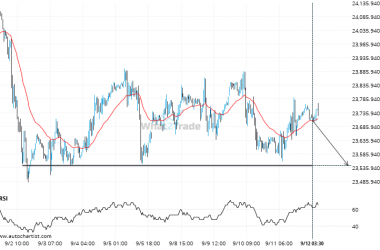
A strong support level has been breached at 21211.6152 on the 30 Minutes NAS 100 chart. Technical Analysis theory forecasts a movement to 21073.8965 in the next 12 hours.

Total
0
Shares
Previous Post

Because Gold Spot formed a Ascending Triangle pattern, we expect it to touch the resistance line. If it breaks through resistance it may move much higher

Next Post

LTCAUD is signaling a possible trend reversal on the intraday charts with price not breaching support.

ARTÍCULOS RELACIONADOS