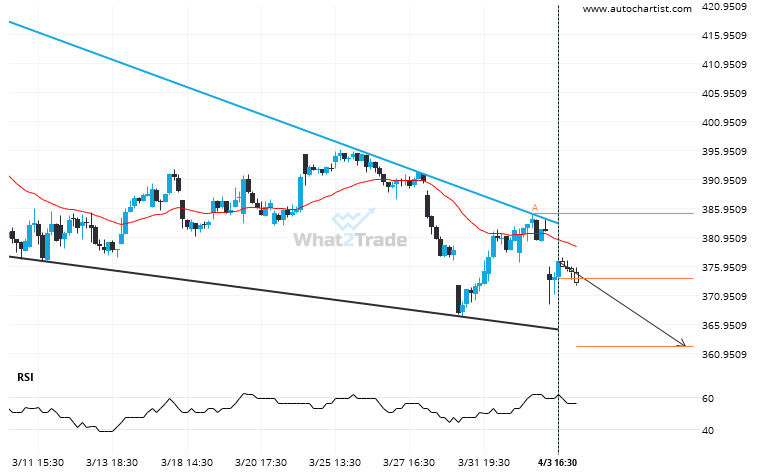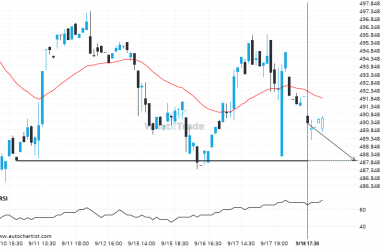
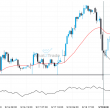
Emerging Falling Wedge pattern in its final wave was identified on the MSFT 1 hour chart. After a strong bearish run, we find MSFT heading towards the upper triangle line with a possible resistance at 362.1408. If the support shows to hold, the Falling Wedge pattern suggests a rebound back towards current levels.
MSFT is signaling a possible trend reversal on the intraday charts with price not breaching resistance.