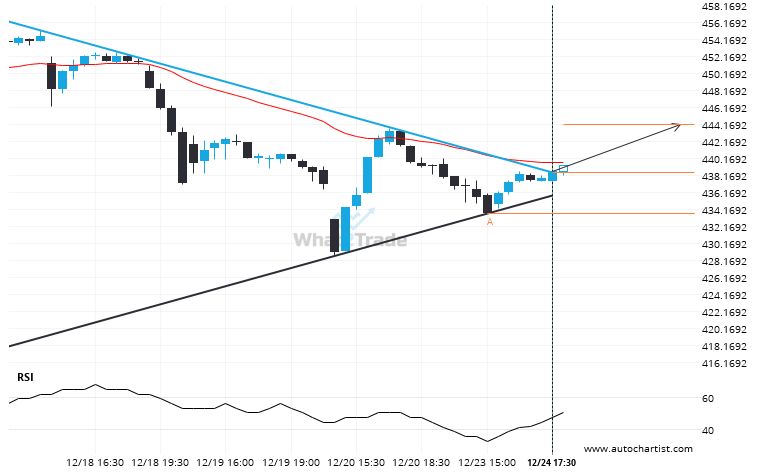
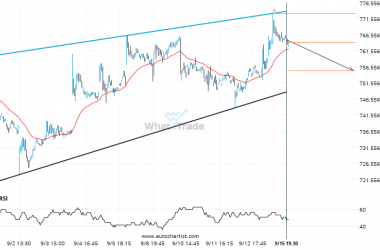
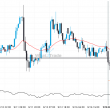
MSFT moved through the resistance line of a Triangle at 438.46939393939397 on the 30 Minutes chart. This line has been tested a number of times in the past and this breakout could mean an upcoming change from the current trend. It may continue in its current direction toward 444.1387.
ARTÍCULOS RELACIONADOS
PYPL likely to test 74.2050 in the near future. Where to next?
PYPL is moving towards a key resistance level at 74.2050. This is a previously tested level for PYPL.…
Important resistance line being approached by V. This price has been tested numerous time in the last 11 days
Emerging Triangle detected on V – the pattern is an emerging one and has not yet broken through…
ADBE seems to be on its way to support – a possible opportunity?
The price of ADBE in heading back to the support area. It is possible that it will struggle…