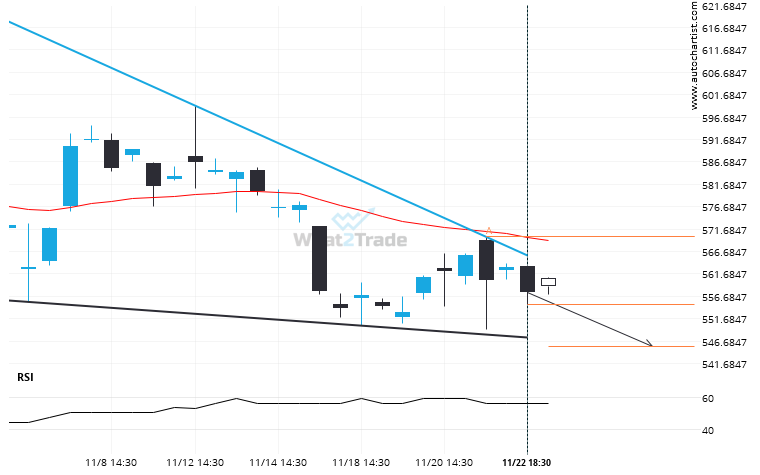
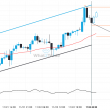
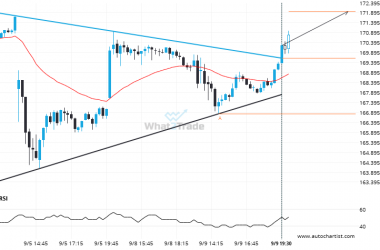
Emerging Falling Wedge pattern in its final wave was identified on the META 4 hour chart. After a strong bearish run, we find META heading towards the upper triangle line with a possible resistance at 545.4313. If the support shows to hold, the Falling Wedge pattern suggests a rebound back towards current levels.
ARTÍCULOS RELACIONADOS
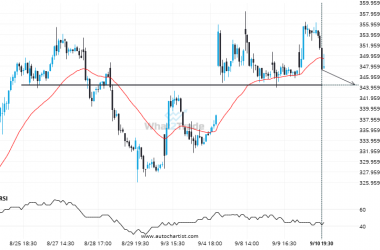
TSLA heading towards a price it has tested 5 times in the recent past.
The movement of TSLA towards 344.4200 price line is yet another test of the line it reached numerous…
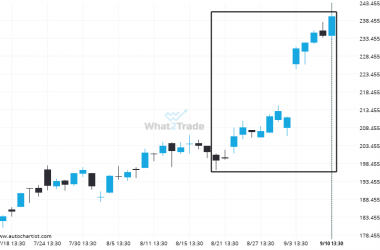
Extreme movement experienced on GOOGL. Check the chart to see what to do next.
GOOGL has moved higher by 20.22% from 199.31 to 239.61 in the last 22 days.
Resistance line breached by NVDA. This price has been tested at least twice before.
NVDA has broken through a resistance line. It has touched this line at least twice in the last…

