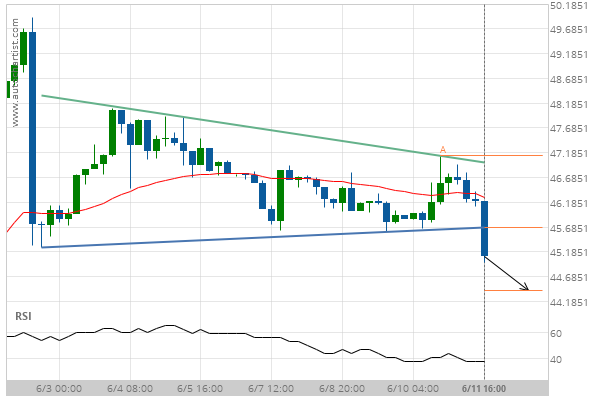
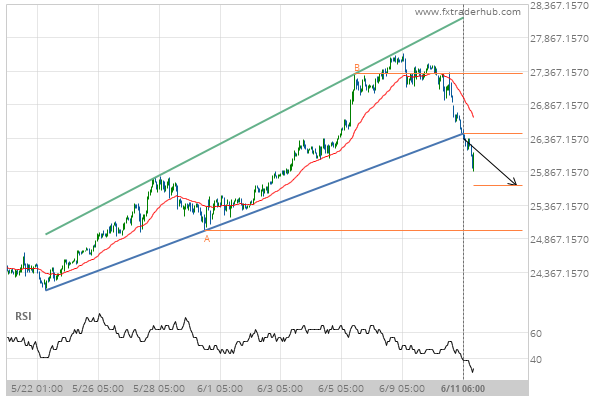
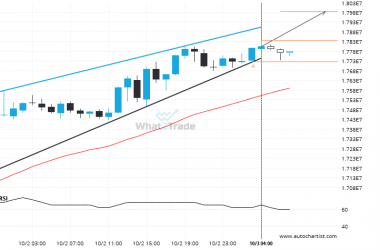
LTCUSD has broken through the support line of a Triangle technical chart pattern. Because we have seen it retrace from this position in the past, one should wait for confirmation of the breakout before trading. It has touched this line twice in the last 10 days and suggests a target line to be around 44.4075 within the next 3 days.
ARTÍCULOS RELACIONADOS
XRPUSD – approaching a resistance line that has been previously tested at least twice in the past
An emerging Rising Wedge has been detected on XRPUSD on the 4 hour chart. There is a possible…
ADAUSD – Large moves like this tend to draw attention.
ADAUSD has moved higher by 6.6% from 0.7985 to 0.8512 in the last 21 hours.
After testing the resistance line numerous times, BTCJPY is once again approaching this line. Can we expect a bullish trend to follow?
BTCJPY is moving towards a resistance line. Because we have seen it retrace from this line before, we…

