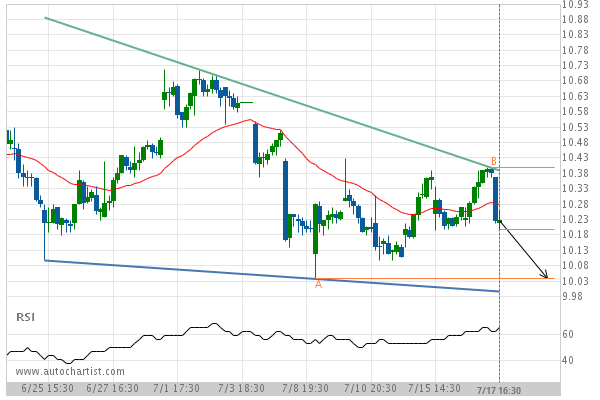
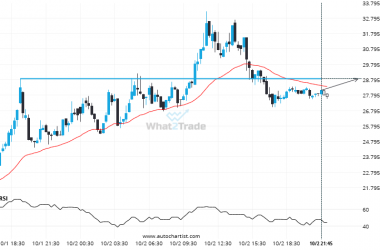
A movement of 16.64% over 8 days on LTCCAD doesn’t go unnoticed. You may start considering where it’s heading next, a continuation of the current downward trend, or a reversal in the previous direction.
ARTÍCULOS RELACIONADOS
ADAUSD – Large moves like this tend to draw attention.
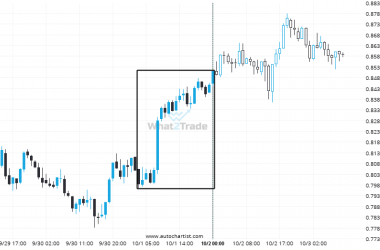
ADAUSD has moved higher by 6.6% from 0.7985 to 0.8512 in the last 21 hours.
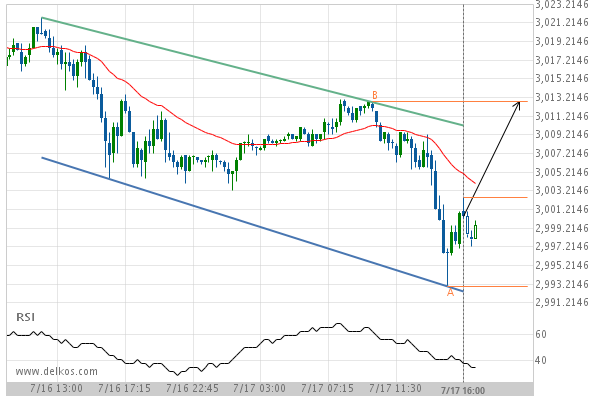
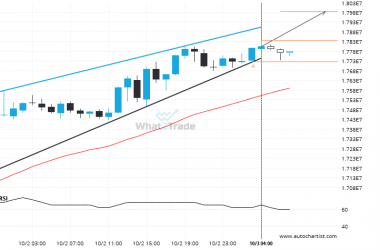
After testing the resistance line numerous times, BTCJPY is once again approaching this line. Can we expect a bullish trend to follow?
BTCJPY is moving towards a resistance line. Because we have seen it retrace from this line before, we…
DASHEUR is quickly approaching a very important level it has previously tested numerous times in the past
The price of DASHEUR in heading back to the resistance area. It is possible that it will struggle…


