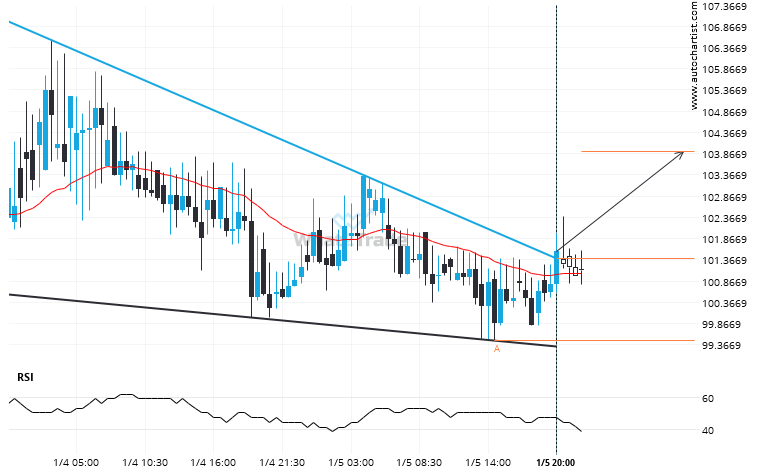
LTCCAD a franchi la ligne resistance. Il a touché cette ligne au moins deux fois au cours des dernières 3 days. Cette cassure peut indiquer un mouvement potentiel vers 103.9163 au cours des dernières 11 hours. Comme nous l’avons vu retracer à partir de cette position dans le passé, il faudra attendre la confirmation de la rupture avant de pouvoir trader.
ARTÍCULOS RELACIONADOS
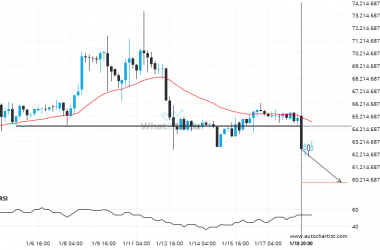
BTCAUD teste actuellement un niveau de 64417.7891. La cassure va-t-elle se poursuivre ou les choses vont-elles s’inverser ?
BTCAUD a traversé la ligne de 64417.7891 et suggère un mouvement possible vers 3 days. Il a déjà…
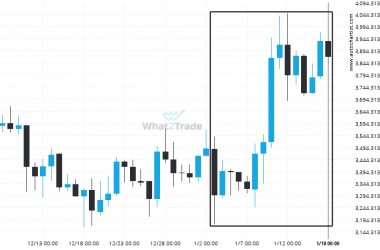
ETHAUD s’élève à 3868.35 dans les 16 derniers jours.
ETHAUD a connu un mouvement extrêmement important au cours de la dernière 15 jours. Il se peut que…
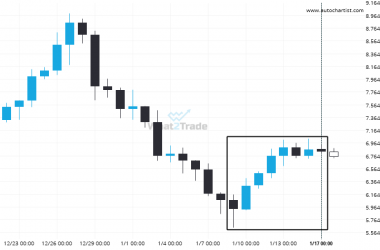
Le mouvement extrêmement important sur DASHBTC est-il un signe de choses à venir ?
DASHBTC a connu un mouvement extrêmement important qui a duré 9. Ce mouvement se situe dans le percentile…

