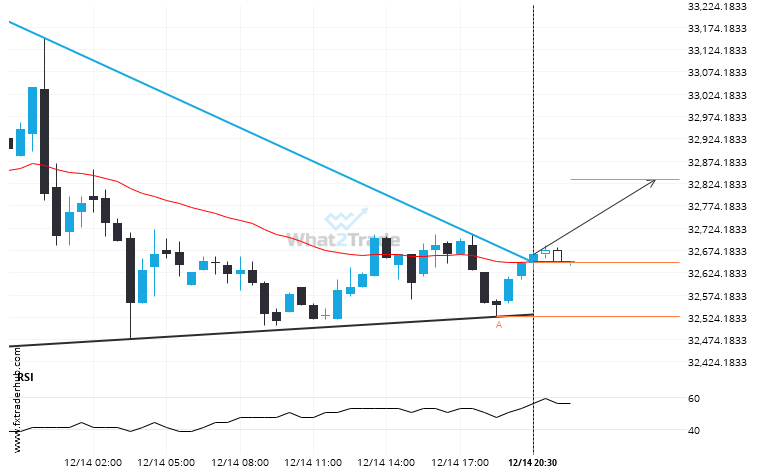
JPN225 moved through the resistance line of a Triangle at 32647.14285714286 on the 30 Minutes chart. This line has been tested a number of times in the past and this breakout could mean an upcoming change from the current trend. It may continue in its current direction toward 32833.6781.
JPN225 through 32647.14285714286. Is this a confirming a breakout? Will it continue its path in the current trend toward 32833.6781?