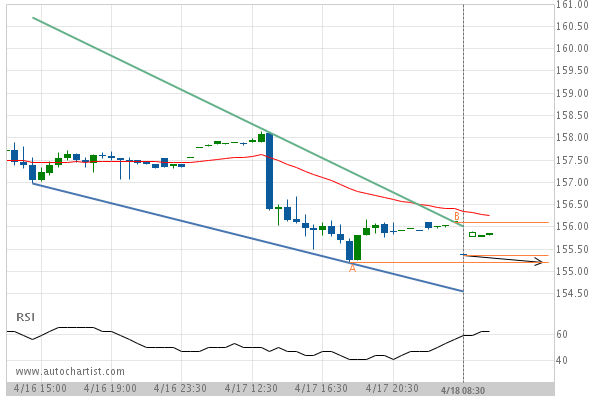
Falling Wedge identified at 18-Apr-2019 08:30 UTC. This pattern is still in the process of forming. Possible bearish price movement towards the support 155.20 within the next 6 hours.
iShares (IWM) Target Level: 155.20

Falling Wedge identified at 18-Apr-2019 08:30 UTC. This pattern is still in the process of forming. Possible bearish price movement towards the support 155.20 within the next 6 hours.