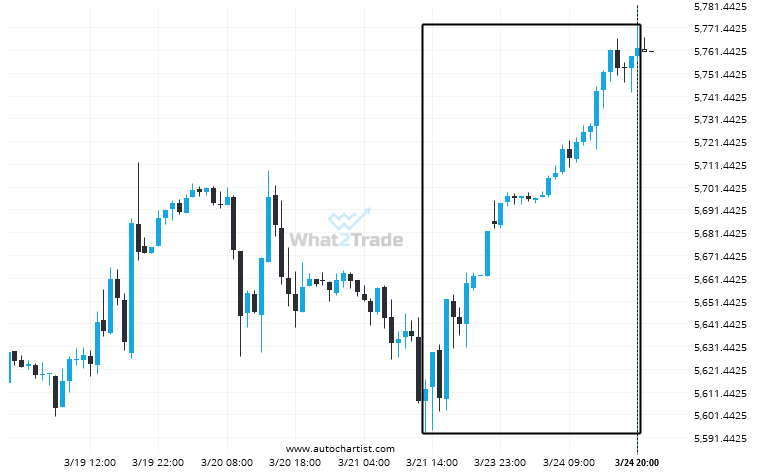
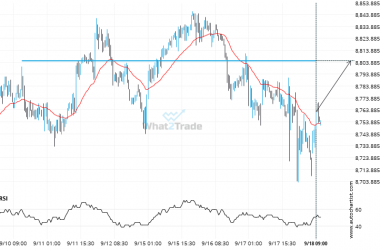
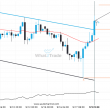
US 500 rose sharply for 3 days – which is an excessively big movement for this instrument; exceeding the 98% of past price moves. Even if this move is a sign of a new trend in US 500 there is a chance that we will witness a correction, no matter how brief.
ARTÍCULOS RELACIONADOS
Rare bullish streak on the NAS 100 4 hour chart.
Rare candle sequence recorded on the NAS 100 4 hour chart, ending at 24497.3588.
If you’re short ASX 200 you should be aware of the rapidly approaching level of 8805.2998
ASX 200 is heading towards a line of 8805.2998. If this movement continues, the price of ASX 200…
FTSE 100 is quickly approaching the support line of a Channel Down. We expect either a breakout through this line or a rebound.
Emerging Channel Down pattern in its final wave was identified on the FTSE 100 4 hour chart. After…