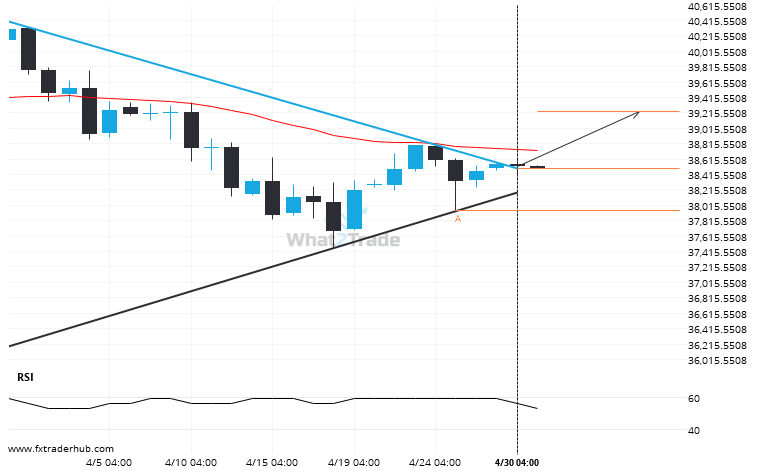
The last 47 Daily candles on US30 formed a Triangle pattern and broken out through the pattern lines, indicating a possible bullish movement towards the price level of 39228.9054.
Interesting opportunity on US30 after breaking 38495.6

The last 47 Daily candles on US30 formed a Triangle pattern and broken out through the pattern lines, indicating a possible bullish movement towards the price level of 39228.9054.