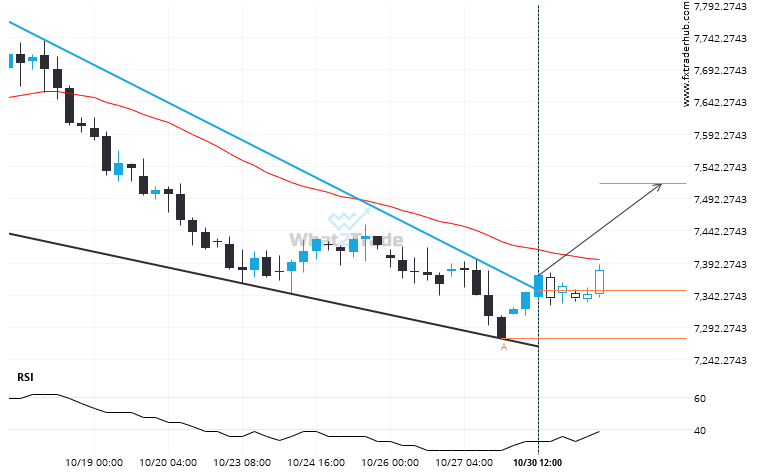
UK100 has broken through a resistance line of a Falling Wedge chart pattern. If this breakout holds true, we may see the price of UK100 testing 7516.0196 within the next 2 days. But don’t be so quick to trade, it has tested this line in the past, so you should confirm the breakout before taking any action.
ARTÍCULOS RELACIONADOS
FTSE 100 breakout from a Rising Wedge trade setup. Will it continue this trend to hit the target price?
FTSE 100 has broken through a support line. It has touched this line at least twice in the…
A final push possible on US 500 as it starts approaching a price line of 6216.5098.
The price of US 500 in heading back to the support area. It is possible that it will…
Important resistance line being approached by DOW 30. This price has been tested numerous time in the last 11 days
DOW 30 was identified at around 44454.24 having recently rebounded of the support on the 4 hour data…