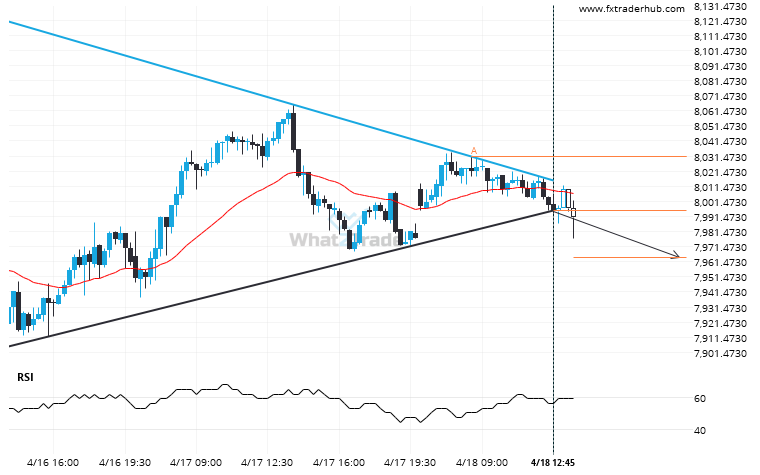
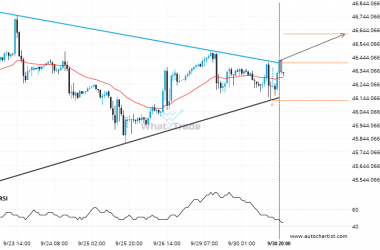
You would be well advised to confirm the breakout that has just occurred – do you believe the move through support to be significant? Do you have confirming indicators that the price momentum will continue? If so, look for a target of 7964.2847 but consider reducing the size of your position as the price gets closer to that target.
ARTÍCULOS RELACIONADOS
Important resistance line being approached by FTSE 100. This price has been tested numerous time in the last 20 days
An emerging Rising Wedge has been detected on FTSE 100 on the 1 hour chart. There is a…
Rare bullish streak on the ASX 200 Daily chart.
ASX 200 posted a high rate of consecutive bullish candles on the Daily chart.
After testing 7892.2002 numerous times, CAC 40 has finally broken through. Can we expect a bullish trend to follow?
CAC 40 has broken through 7892.2002 which it has tested numerous times in the past. We have seen…