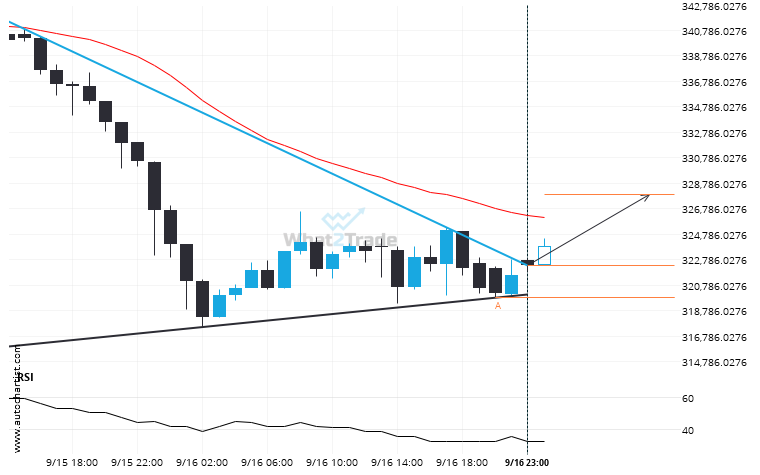
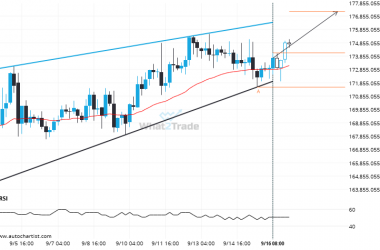
ETHJPY moved through the resistance line of a Triangle at 322312.754 on the 1 hour chart. This line has been tested a number of times in the past and this breakout could mean an upcoming change from the current trend. It may continue in its current direction toward 327903.2234.
ARTÍCULOS RELACIONADOS
A possible move on ETHJPY as it heads towards support
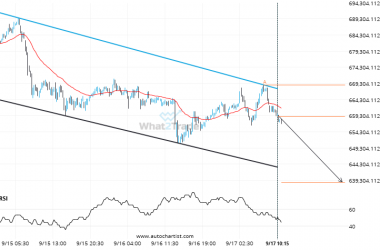
An emerging Channel Down has been detected on ETHJPY on the 15 Minutes chart. There is a possible…
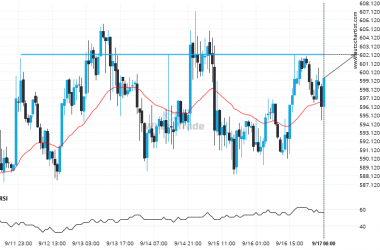
After testing 602.1300 numerous times, BCHUSD is once again approaching this price point. Can we expect a bullish trend to follow?
BCHUSD is moving towards a resistance line. Because we have seen it retrace from this level in the…
BTCAUD is approaching a resistance line of a Rising Wedge. It has touched this line numerous times in the last 15 days.
BTCAUD is moving towards a resistance line. Because we have seen it retrace from this line before, we…

