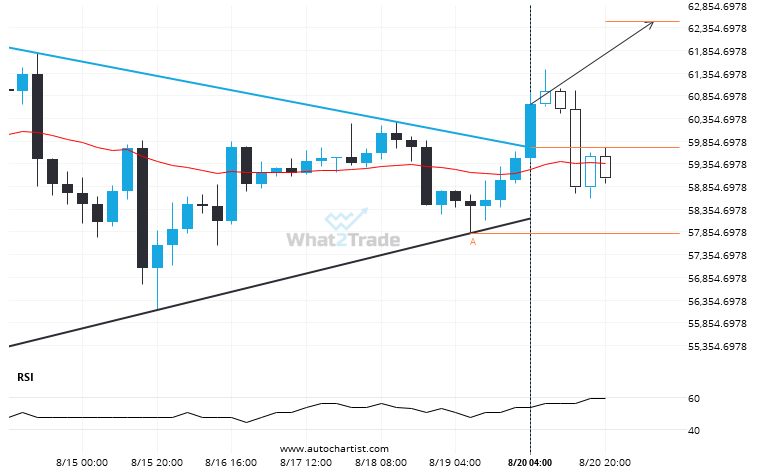
BTCUSD moved through the resistance line of a Triangle at 59715.30125 on the 4 hour chart. This line has been tested a number of times in the past and this breakout could mean an upcoming change from the current trend. It may continue in its current direction toward 62496.1770.
ARTÍCULOS RELACIONADOS
Because ETHAUD formed a Rising Wedge pattern, we expect it to touch the support line. If it breaks through support it may move much lower
Emerging Rising Wedge detected on ETHAUD – the pattern is an emerging one and has not yet broken…
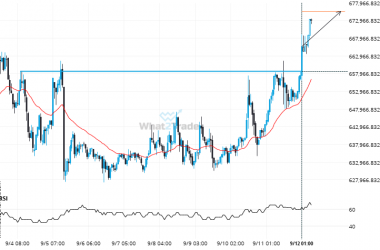
It’s time to make a decision on ETHJPY – its recent breach of 658561.4375 could be a sign of a new trend to follow.
The breakout of ETHJPY through the 658561.4375 price line is a breach of an important psychological price that…
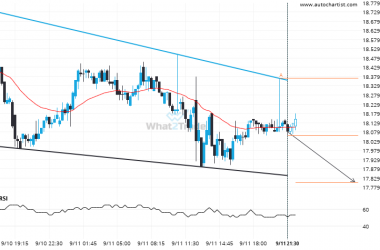
A Falling Wedge has formed, DASHGBP is approaching resistance. Can we expect a breakout and the start of a new trend or a reversal?
The movement of DASHGBP towards the support line of a Falling Wedge is yet another test of the…


