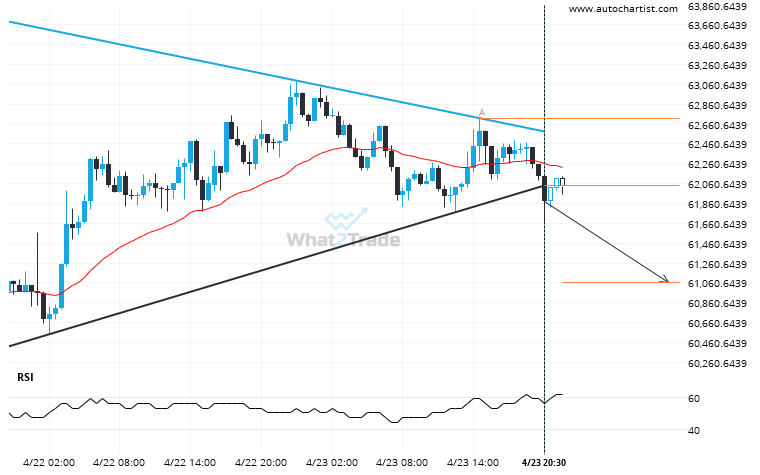
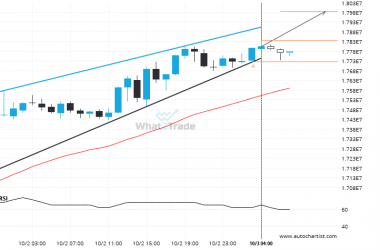
BTCEUR has broken through the support line of a Triangle technical chart pattern. Because we have seen it retrace from this line in the past, one should wait for confirmation of the breakout before taking any action. It has touched this line twice in the last 4 days and suggests a possible target level to be around 61061.1162 within the next 12 hours.
ARTÍCULOS RELACIONADOS
ETHBTC – approaching a resistance line that has been previously tested at least twice in the past
ETHBTC is heading towards the resistance line of a Channel Down and could reach this point within the…
Important price line breached by LTCEUR. This price has been tested numerous times before.
LTCEUR has broken through a resistance line. It has touched this line numerous times in the last 4…
XRPUSD – approaching a support line that has been previously tested at least twice in the past
The movement of XRPUSD towards the support line of a Falling Wedge is yet another test of the…