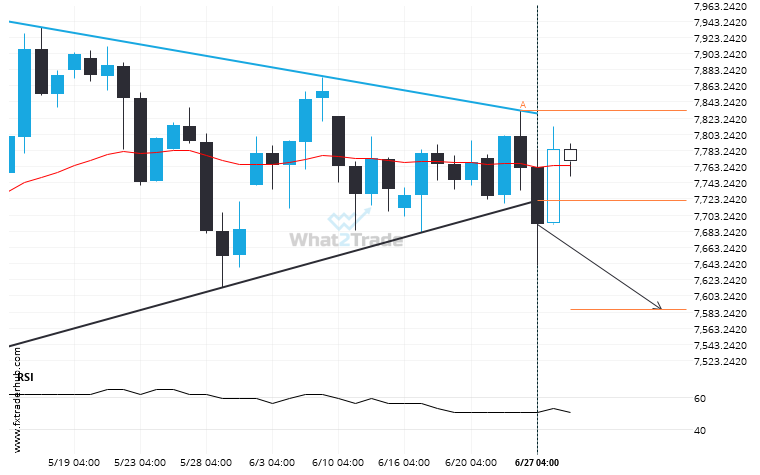
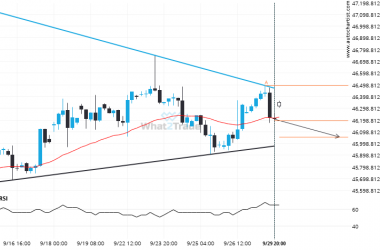
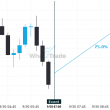
AUS200 has broken through a support line of a Triangle chart pattern. If this breakout holds true, we may see the price of AUS200 testing 7586.3546 within the next 8 days. But don’t be so quick to trade, it has tested this line in the past, so you should confirm the breakout before taking any action.
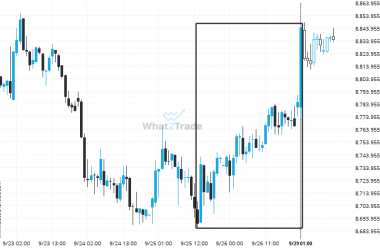
ARTÍCULOS RELACIONADOS
NAS100 may be on a start of a new bullish trend after its breakout through this important resistance level
The price of NAS100 in heading in the direction of 20234.1992. Despite the recent breakout through 20086.0000 it…
After testing 39414.0000 numerous times, US30 is once again approaching this price point. Can we expect a bearish trend to follow?
The movement of US30 towards 39414.0000 price line is yet another test of the line it reached numerous…
UK100 seems to be on its way to support – a possible opportunity?
UK100 is approaching a support line at 8109.0000. If it hits the support line, it may break through…