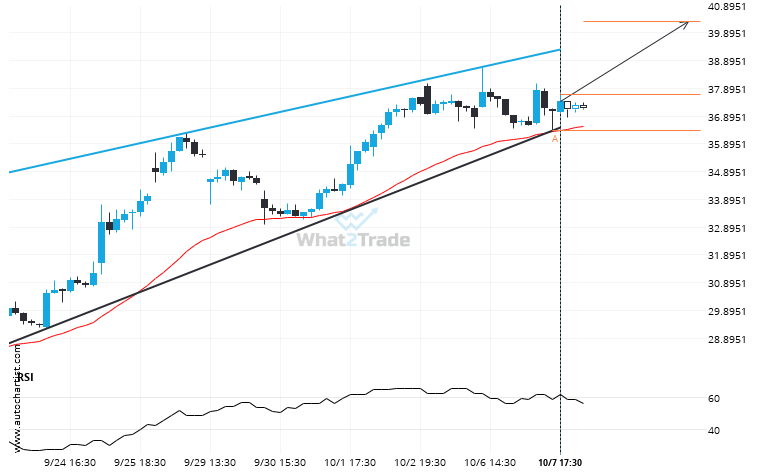
Emerging Rising Wedge pattern in its final wave was identified on the INTC 1 hour chart. After a strong bullish run, we find INTC heading towards the upper triangle line with a possible resistance at 40.3093. If the resistance shows to hold, the Rising Wedge pattern suggests a rebound back towards current levels.
ARTÍCULOS RELACIONADOS
AAPL likely to test 253.7800 in the near future. Where to next?
AAPL is approaching a support line at 253.7800. If it hits the support line, it may break through…
V formed a Rising Wedge on the 1 hour chart. Retest of resistance in sight.
V is heading towards the resistance line of a Rising Wedge and could reach this point within the…
Extreme movement experienced on TSLA. Check the chart to see what to do next.
TSLA recorded a considerable move in the last day — one of its biggest in recent sessions.

