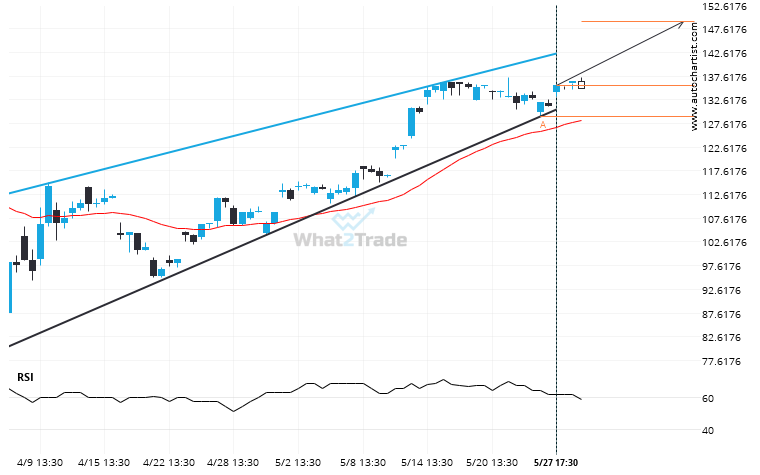
NVDA is moving towards a resistance line which it has tested numerous times in the past. We have seen it retrace from this line before, so at this stage it isn’t clear whether it will breach this line or rebound as it did before. If NVDA continues in its current trajectory, we could see it reach 149.1837 within the next 3 days.
ARTÍCULOS RELACIONADOS
TSLA has formed 4 bearish candles successively, what is the probability of getting another bearish candle?
Due to the rate of consecutive bearish candles on TSLA 4 hour chart we could be in for…
PFE is quickly approaching the support line of a Triangle. We expect either a breakout through this line or a rebound.
A Triangle pattern was identified on PFE at 23.105, creating an expectation that it may move to the…
Supports and resistances are primary concepts of technical analysis. MSFT is heading for an important price of 454.7450 – read about what this could mean for the future.
The movement of MSFT towards 454.7450 price line is yet another test of the line it reached numerous…