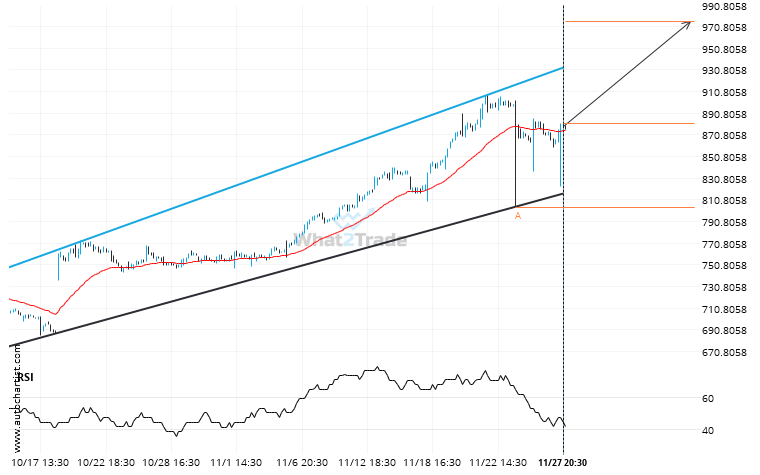
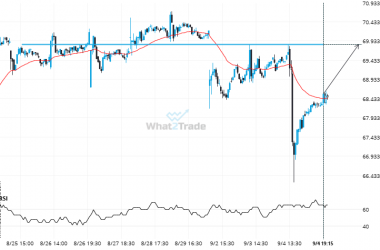
NFLX is moving towards a resistance line which it has tested numerous times in the past. We have seen it retrace from this line before, so at this stage it isn’t clear whether it will breach this line or rebound as it did before. If NFLX continues in its current trajectory, we could see it reach 975.7812 within the next 3 days.
ARTÍCULOS RELACIONADOS
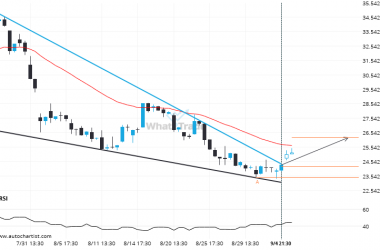
After testing resistance twice in the past, MRNA has finally broken through. Can we expect a bullish trend to follow?
The breakout of MRNA through the resistance line of a Falling Wedge could be a sign of the…
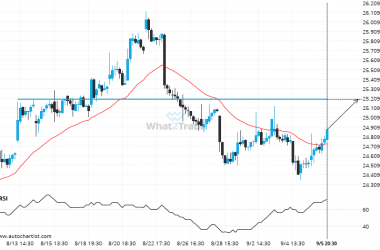
PFE heading towards a price it has tested 4 times in the recent past.
PFE is moving towards a key resistance level at 25.2000. PFE has previously tested this level 4 times…
PYPL keeps moving closer towards 69.8500. Will it finally breach this level?
PYPL is moving towards a key resistance level at 69.8500. PYPL has previously tested this level 5 times…

