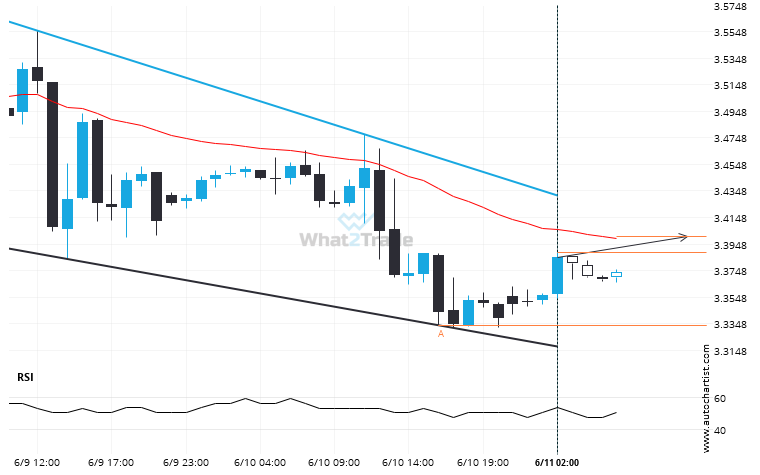
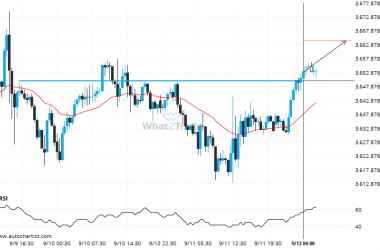
A Channel Down pattern was identified on Natural Gas at 3.3885, creating an expectation that it may move to the resistance line at 3.4004. It may break through that line and continue the bullish trend or it may reverse from that line.
ARTÍCULOS RELACIONADOS
Brent Crude is signaling a possible trend reversal on the intraday charts with price not breaching resistance.
Emerging Channel Up pattern in its final wave was identified on the Brent Crude 1 hour chart. After…
If you’re short Natural Gas you should be aware of the rapidly approaching level of 3.4655
Natural Gas is en route to a very important line that will be a definite deciding factor of…
After testing the support line numerous times, Gold Spot is once again approaching this line. Can we expect a bearish trend to follow?
Gold Spot is heading towards the support line of a Channel Down. If this movement continues, the price…