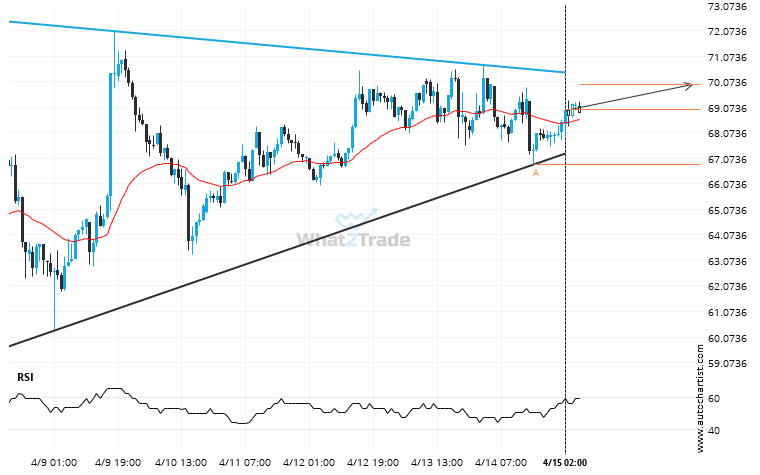
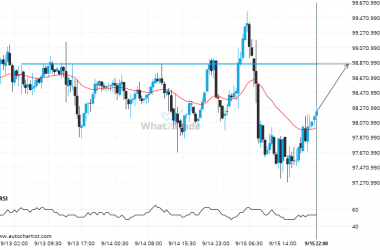
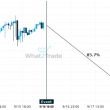
LTCEUR was identified at around 68.99 having recently rebounded of the support on the 1 hour data interval. Ultimately, the price action of the stock has formed a Triangle pattern. This squeeze may increases the chances of a strong breakout. The projected movement will potentially take the price to around the 69.9498 level.
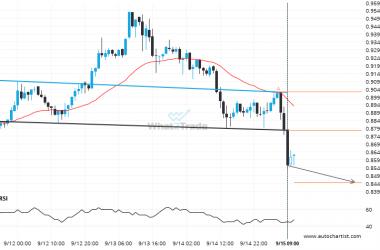
ARTÍCULOS RELACIONADOS
LTCAUD has broken through a level it has tested 3 times in the recent past.
A strong resistance level has been breached at 174.1900 on the 1 hour LTCAUD chart. Technical Analysis theory…
Breach of resistance could mean a start of a bullish trend on XRPUSD
The last 12 4 hour candles on XRPUSD formed a Channel Down pattern and broken out through the…
Supports and resistances are primary concepts of technical analysis. DASHBTC is heading for an important price of 1.8280E-04 – read about what this could mean for the future.
DASHBTC is heading towards 1.8280E-04 and could reach this point within the next 2 days. It has tested…